
Figures & data
Table 1. Organisms cultured from clinical samples by participant.
Figure 1. Stacked bar charts representing the relative abundances (% of OTUs in sample) of five most prominent phyla by sampling timepoint.
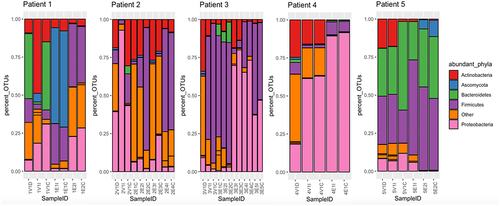
Figure 2. Shannon α-diversity index, at species level, of participant samples.
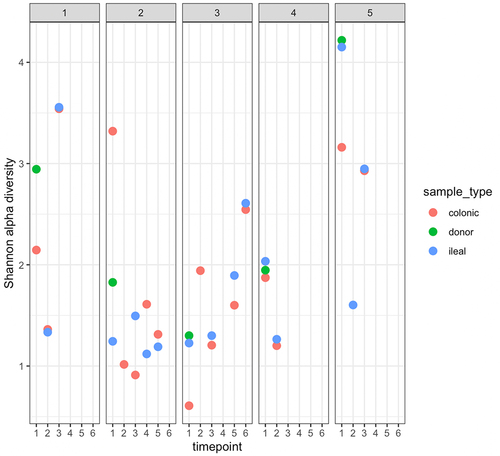
Figure 3. Quantification of antimicrobial resistance genes (ARG) present in participant samples.
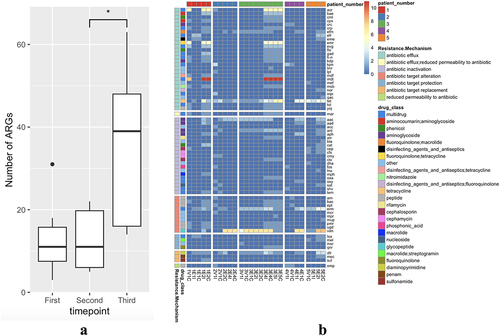
Table 2. Clinical summary of participants.
Figure 4. Multivariable association matrix depicting the top 50 functional pathway genes with significant alterations.
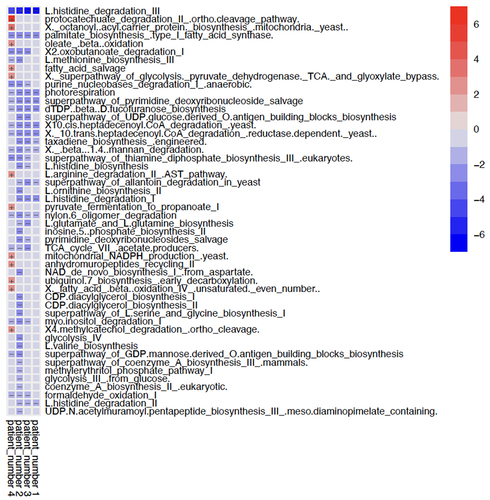
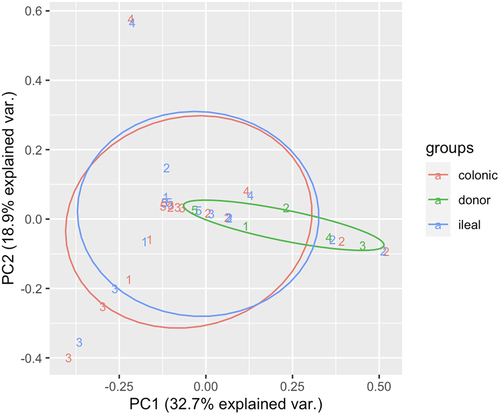
Figure 5. Principal coordinate analysis depicting the microbial composition of the three sample types: donor, recipient ileum and recipient colon.
Revised_SBT_supplementary_data_18122023.docx
Download MS Word (14.7 MB)Data availability statement
The authors confirm that the data supporting the findings of this study are available in the article and its supplementary materials. The microbial WMS reads for 40 patient samples and WGS reads for 3 bacterial isolates have been deposited in the NCBI Sequence Read Archive under BioProject accession PRJNA1004534.