
Figures & data
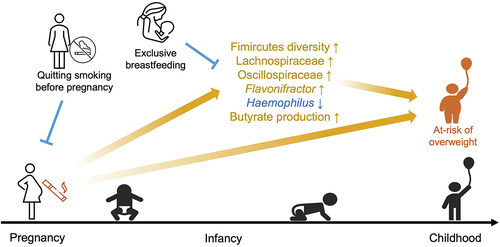
Figure 1. Schematic diagram for data collection and the association between maternal smoking during pregnancy and BMI z-scores of infants.
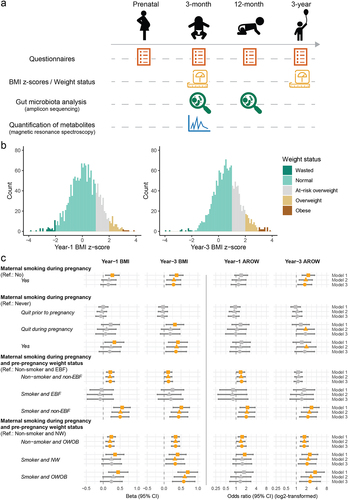
Table 1. Characteristics of the study subjects by exposure to maternal smoking during pregnancy.
Figure 2. Associations between maternal smoking during pregnancy and profiles of gut microbiota in infancy.
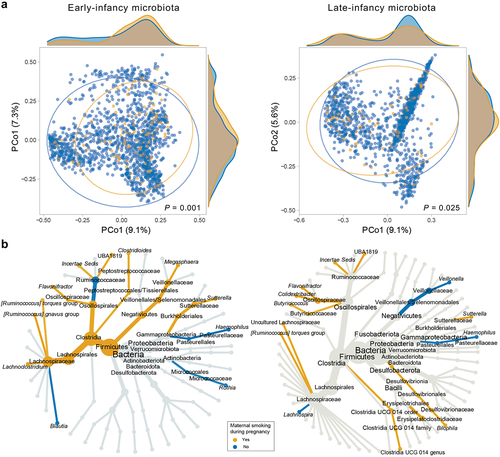
Figure 3. Early-infancy microbial mediators in the pathway from maternal smoking during pregnancy to weight outcomes at 1 and 3 years.
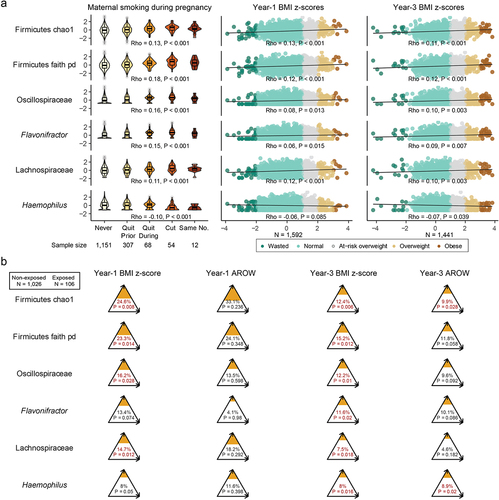
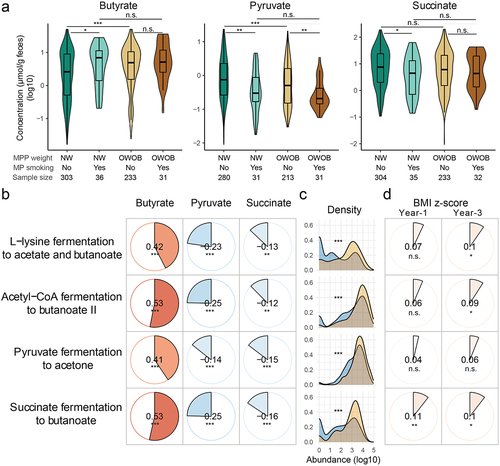
Figure 4. Metabolite mediators.
R2_Supplementary_materials_clean.docx
Download MS Word (2.8 MB)Data availability statement
De-identified data are available from the corresponding author upon reasonable request. Registration and/or proposal applications may be needed depending on the tier of access requested (https://childstudy.ca/for-researchers/data-access/).