
Figures & data
Figure 1. Metatranscriptomics workflow for synthetic host-microbiome samples.
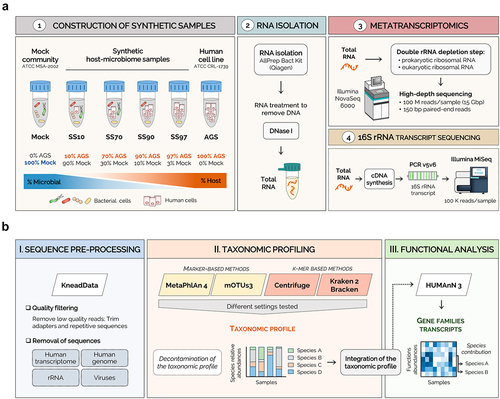
Table 1. The settings used with different parameters for each taxonomic classifier to improve the identification of species.
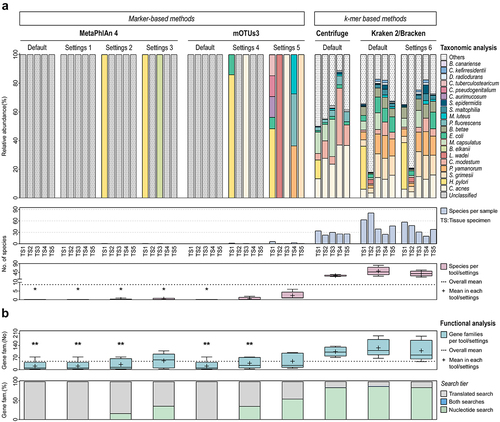
Figure 2. Kraken 2/Bracken with optimized settings accurately profiles the metatranscriptome of synthetic samples with low microbial biomass.
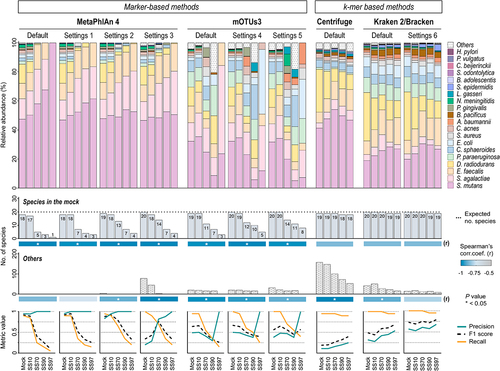
Figure 3. 16S rRNA transcript sequencing validates the metatranscriptome profiles of Kraken 2/Bracken with optimized settings.
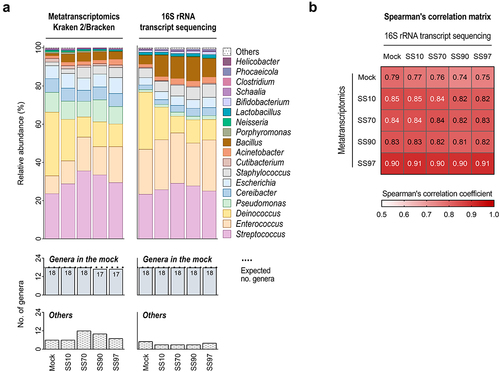
Figure 4. Kraken 2/Bracken with optimized settings has high sensitivity to profile the metatranscriptome in low microbial biomass simulated datasets.
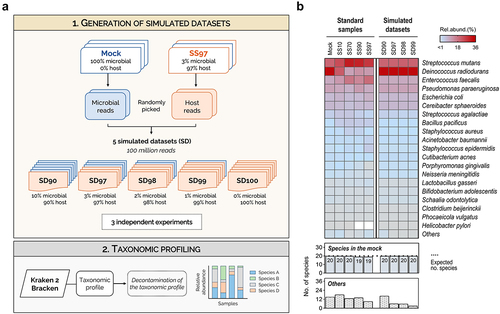
Figure 5. Kraken 2/Bracken improves HUMAnN 3 functional analysis of the metatranscriptome of synthetic samples with low microbial biomass.
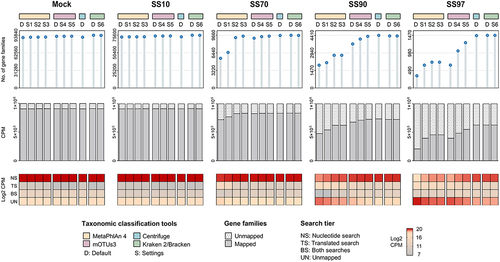
Figure 6. Effective application of the metatranscriptomics method in human clinical samples.
Supplemental Material
Download PDF (868.9 KB)Data availability statement
The raw sequence data of the datasets generated in the current study are available at the NCBI BioProject under the accession number: PRJNA1003801.