
Figures & data
Figure 1. A Mediterranean-ketogenic diet, compared to a standard Western-style diet, improves body-composition in APP/PS1 mice. (a) Schematic study design. (b) Weekly changes in bodyweight. (c) Differences in body mass (%) were evaluated in terms of total fat and lean mass per group. Comparison of (d) total gastrointestinal length and (e) liver weight. Blood glucose level changes in response to (f) oral glucose tolerance test and (g) intraperitoneal insulin tolerance test. The area under curve (AUC) was calculated as an index of glucose tolerance or insulin tolerance for each test. (h) Gut permeability measured by FITC-dextran (n=5/group). See also Figure S1. Data are presented as mean ± SD. Significance was determined by the one-way ANOVA test with post-hoc Dunn’s test. n=8–9 per group (except for gut permeability test). #p<0.1; *p<0.05; **p<0.01; ***p<0.001. For the line plots, the significance between groups was differentiated by color. Light gray color represents the difference between WT-WD and AD-WD, dark gray; WT-WD and WT-MkD, and red; WT-MkD and AD-MkD. WT: wild-type; AD: Alzheimer’s disease (APP/PS1 transgenic) mice; MkD: Mediterranean-ketogenic diet; WD: Western-style diet.
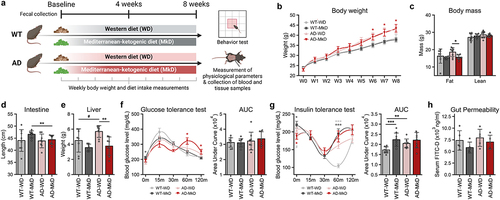
Figure 2. Mediterranean-ketogenic diet, versus a standard Western-style diet, improves neurocognitive and behavioral function in APP/PS1 mice. (a) Results of the open-field test, including time spent in the center area, total traversed distance, and freezing time (n=5/group). (b) Results of the T-maze spontaneous test, including the average time spent making decisions and the alternation score, which counts the alternative decisions compared to the previous trial (n=8–9/group). (c) Time spent near familiar and novel objects, along with the discrimination index value in the novel object test (n=4/group). (d) Time spent on the hanging wire (n=8–9/group). (e) Latency to fall on the rotating rod (n=8–9/group). (f) Correlation between behavioral outcomes using Spearman’s correlation. (g) Heatmap illustrating the differences in behavior assays outcomes on genotype and diet, as determined using a two-way ANOVA model (● p<0.1; ●● p<0.05). See also Figure S1. Data are presented as mean ± SD. Significance was determined by the one-way ANOVA test with post-hoc Dunn’s test. *p<0.05; ***p<0.001. WT: wild-type; AD: Alzheimer’s disease (APP/PS1 transgenic) mice; MkD: Mediterranean-ketogenic diet; WD: Western-style diet.
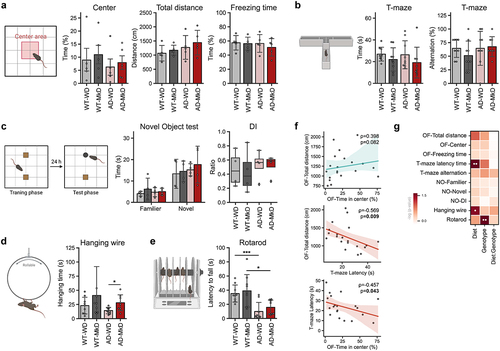
Figure 3. Mediterranean-ketogenic diet, versus standard Western-style diet, induces distinct and beneficial arrays of gut microbiome diversity and composition in APP/PS1 mice. (a) Alpha-diversity was determined using the Shannon index and Chao1 index. Significance between groups was calculated using the non-parametric Kruskal-Wallis test. (b) PCoA analysis based on Bray-Curtis dissimilarity was used to represent the beta-diversity of each group, genotype, and diet. Significance was calculated using PERMANOVA with 999 random permutations. Relative abundance of bacterial microbiome composition at the (c) phylum and (d) genus level. (e) Bacterial microbiome composition differences between groups were analyzed using the linear discrimination analysis (LDA) effect size (LEfSe) algorithm (LDA>3.0, p-value<0.05). (f) The heatmap represents the taxa changes over time for each group. Spearman’s correlation was used, and significantly correlated taxa (p<0.05) are indicated with a ‘●’ sign. See also Figure S3. n=8–9 per group. Data are presented as mean ± SD. *p<0.05; **p<0.01. WT: wild-type; AD: Alzheimer’s disease (APP/PS1 transgenic) mice; MkD: Mediterranean-ketogenic diet; WD: Western-style diet.
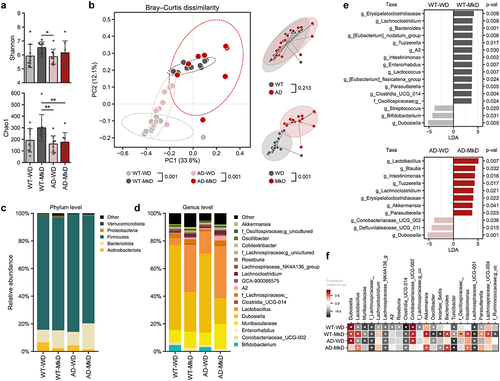
Figure 4. Mediterranean-ketogenic diet, versus standard Western-style diet, distinctly modulates the gut and blood metabolome in APP/PS1 mice. PCoA analysis of (a) fecal and (d) serum metabolites (untargeted global metabolome) was conducted based on Bray-Curtis dissimilarity, representing the beta-diversity of each group, genotype, and diet. Significance was calculated using PERMANOVA with 999 random permutations. The abundance of metabolites and the ranking of groups or diets by their average abundance are shown for (b) fecal and (e) serum metabolites. For the abundance heatmap, z-scores were calculated based on the average abundance of each group. Dendrograms were generated using hierarchical clustering results with the average linkage method, based on Bray-Curtis dissimilarity. Spearman’s correlation results between diets within each genotype are shown for (c) fecal and (f) serum metabolites. See also Figure S6. n=8–9 per group for fecal metabolome and n=5 per group for serum metabolome. WT: wild-type; AD: Alzheimer’s disease (APP/PS1 transgenic) mice; MkD: Mediterranean-ketogenic diet; WD: Western-style diet.
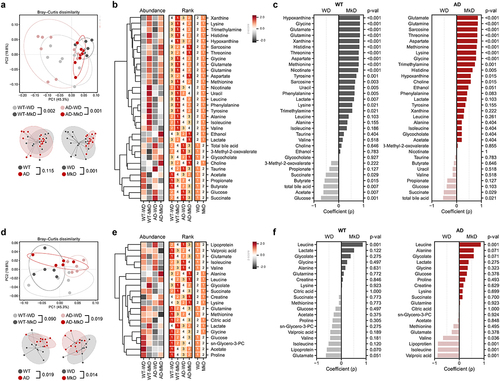
Figure 5. Mediterranean-ketogenic diet, versus standard Western-style diet, distinctly shapes the gut microecological niche via modulating the multi-omics arrays of host microbe-metabolite co-regulation interactions. Circular heatmap illustrating the differences in dominant (a) bacterial and fungal genera and gut and serum metabolites based on genotype and diet, as determined using a two-way ANOVA model. P-values were -log transformed and used for visualization. The dendrogram was generated using hierarchical clustering results with the average linkage method, based on Bray-Curtis dissimilarity. Significant taxa (p<0.05) are indicated with a ‘●’ sign. (b) Microbiota-metabolites co-occurrence network. Circular nodes represent genera (white: bacteria, gray: fungi), while yellow octagon nodes represent metabolites. Only significant links are shown here (Spearman’s rank correlation coefficient (ρ) >0.5; Benjamini–Hochberg corrected p<0.05). Red links denote positive correlation and black links indicate negative correlation, with line thickness corresponding to the correlation coefficient value. A random-forest prediction model between groups based on combined abundance data of microbiome and metabolome. (c) Receiver operating characteristic (ROC) curve depicts the classification accuracy, while (d) a bar graph highlights the top 20 most strongly predictive genera and metabolites based on relative importance scores. WT: wild-type; AD: Alzheimer’s disease (APP/PS1 transgenic) mice; MkD: Mediterranean-ketogenic diet; WD: Western-style diet.
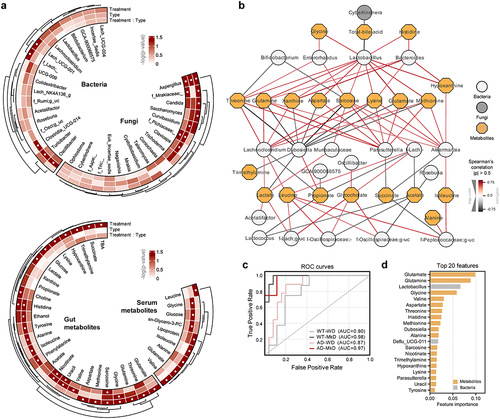
Figure 6. Mediterranean-ketogenic diet, versus standard Western-style diet, ameliorates gut and brain barrier integrity and lowers intestinal and neuronal inflammation in association with improved neurocognitive and behavioral functions in APP/PS1 mice. Gene expression of tight-junction proteins (CLDN1, CLDN3, and CLDN12) and inflammatory markers (IL-1β, IL-8, IL-10, IL-17, and TNF-α) in (a) colon and (b) ileum. Gene expression of tight-junction proteins (CLDN5, ZO-1, and OCLN) and inflammatory markers (IL-1β, IL-6, IL-8, IL-10, and TNF-α) in (c) hippocampus and (d) hypothalamus. Data are presented as mean ± SD. Significance was determined by unpaired t-tests between WT-WD and WT-MkD, as well as between AD-WD and AD-MkD. See also Figure S7-S8. n=6–8 per group. #p<0.1; *p<0.05. WT: wild-type; AD: Alzheimer’s disease (APP/PS1 transgenic) mice; MkD: Mediterranean-ketogenic diet; WD: Western-style diet.
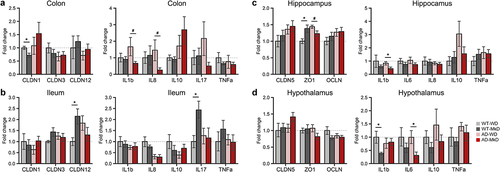
Figure 7. A Mediterranean-ketogenic diet increases lactate and leucine levels in both the gut and blood, which upregulate lactate receptor and induce changes in brain metabolome in APP/PS1 mice. (a) Relative abundance of gut and serum lactate. (b) Relative abundance of gut and serum leucine. (c) Bacterial biosynthesis pathway and associated genes for lactate and the predicted relative abundance of genes (KO orthology). (d) Protein levels of lactate receptor (GPR81) and AD biomarkers (Aβ and total-/phosphorylated-tau) in brain were quantified by Western blot (n=4/group). (e) The protein levels are presented by fold-change calculated compared to WT-WD group. (f) PCoA analysis of brain metabolites (untargeted global metabolome) was conducted based on Bray-Curtis dissimilarity, representing the beta-diversity of each group, genotype, and diet. Significance was calculated using PERMANOVA with 999 random permutations. (g) The abundance of metabolites and the ranking of groups or diets by their average abundance are shown for brain metabolites. For the abundance heatmap, z-scores were calculated based on the average abundance of each group. Dendrograms were generated using hierarchical clustering results with the average linkage method, based on Bray-Curtis dissimilarity. (h) Spearman’s correlation results between diets within each genotype are shown for brain metabolites. See also Figure S9–10. n=8–9 per group (except for Western blot). Data are presented as mean ± SD. Significance was determined using unpaired t-tests between WT-WD and WT-MkD, as well as between AD-WD and AD-MkD. #p<0.1; *p<0.05; **p<0.01; ***p<0.001. WT: wild-type; AD: Alzheimer’s disease (APP/PS1 transgenic) mice; MkD: Mediterranean-ketogenic diet; WD: Western-style diet.
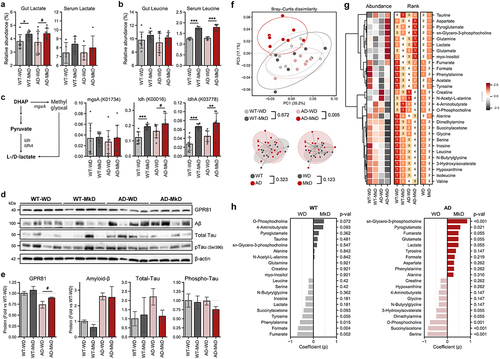
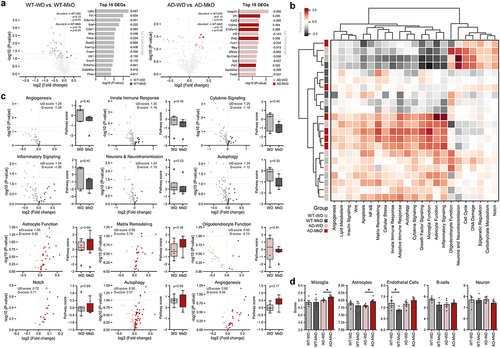
Figure 8. Mediterranean-ketogenic diet, versus standard Western-style diet, distinctly modulates the transcriptional arrays in hippocampus in APP/PS1 mice (a) volcano plots showing differentially expressed genes (DEGs) (log2 fold-change), and top 15 DEGs most significantly changed by diet. (b) Heatmap based on the pathway score of each sample for 23 neuroinflammation-associated pathways. The dendrogram was generated using hierarchical clustering results with the complete linkage method, based on Euclidean distance. (c) Volcano plots showing differentially expressed pathway associated DEGs and bar graphs of pathway signature scores of samples for top six differentially expressed pathways in WT and AD group respectively. (d) Predicted cell type abundance. Differences in pathway score and cell type were between WT-WD and WT-MkD and AD-WD, as well as AD-MkD were assessed with Mann–Whitney U test. n=6 per group. #p<0.1; *p<0.05. WT: wild-type; AD: Alzheimer’s disease (APP/PS1 transgenic) mice; MkD: Mediterranean-ketogenic diet; WD: Western-style diet.
Supplemental Material
Download Zip (2.5 MB)Data availability statement
The data that support the findings of this study are openly available in National Center for Biotechnology Information (NCBI)-Sequence Read Archive (SRA) at https://www.ncbi.nlm.nih.gov/sra, reference number PRJNA1011002 (16S rRNA sequencing dataset) and PRJNA1010986 (ITS rRNA sequencing dataset).