
Figures & data
Figure 1. Altered composition of the gut microbiota during IAV infection. (a), left panel, Bray Curtis based nonmetric multidimensional scaling plot of all samples (stress value = 0.09). Each spot represents one sample and each group of mice is denoted by a different color (blue: non-infected/Day 0, red: D7, orange, D14). Distance between dots represents extent of compositional difference. right panel, Bray Curtis distance among samples at D0 (reference) and between each samples at D7 or D14 and D0. (b and c), relative abundance of taxa significantly different between D7 and D0 or D14 at the phylum (b), and species (c) level. Blue represents D0 samples; red represents D7; orange represents D14. Significant differences were determined using the Kruskal-Wallis test. Significant differences were determined using the Kruskal-Wallis test (* p < 0.05, ** p < .01, *** p < .001, **** p < .0001). NMDS, non-metric multidimensional scaling plot.
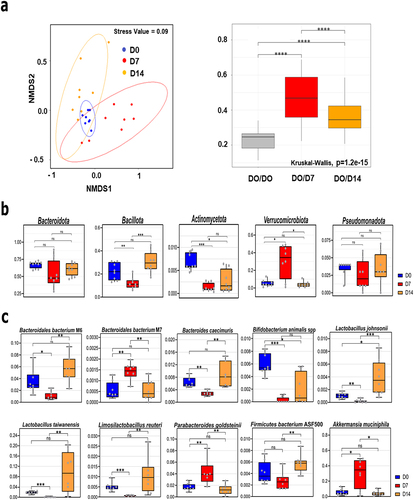
Table 1. Analysis of similarity (ANOSIM) and dissimilarity (PERMANOVA) with associated p values to test sample grouping (10,000 permutations).
Figure 2. Functional profiles of the gut microbiota during IAV infection. (a and b), PCA of normalized relative abundances of KOs (a) and module scores (b). (c), representation at the category level of the KOs with the most varying songbird coefficients aggregated at the module level. For each module, the coefficients of the KOs taking part in it are summed up. Then, modules were grouped into categories according to larger biological functions. Each dot on the plot represents the sum of KO coefficients for a module. Red lines are medians and boxes represent Q1 and Q3. A positive coefficient means an increase of the module on D7, whereas a negative coefficient illustrates a decrease. The higher or lower the coefficient, the greater the change. Red arrows indicate increased categories and blue arrows indicate lowered categories. Asterisks denote categories decreased on D7 and increased on D14. The categories not shown have modules with KOs with null abundance (not detected) or not selected (not in the top 25% of the KOs with the most extreme coefficients).
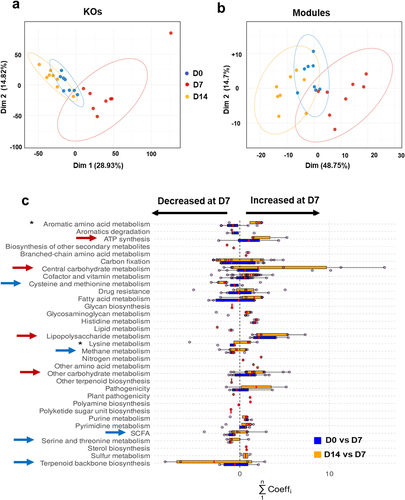
Figure 3. Alteration of specific metabolic compartments during influenza as assessed by shotgun analysis. (a and b), alteration of the abundance of genes involved in SCFA synthesis. (a), PCA of normalized relative abundances of modules covering SCFAs metabolism. (b), density ridgeline plots of the songbird coefficients of gomixer modules involved in SCFA synthesis and degradation. A positive coefficient is associated with an increase of the module’s KOs in D7, whereas a negative coefficient is associated with a decrease. The coefficients/differentials of the KOs computed by songbird are plotted on the x-axis (thin bars). The thick bar is the origin of the x-axis. (c–f), density ridgeline plots of the songbird coefficients of gomixer modules involved in LPS (c), fatty acid (b), polyamine (c), amino acid (arginine, proline, serine, threonine, cysteine and methionine) (d), branched- amino acid (d), branched chain amino acid (e), and aromatic amino acid (f) synthesis and degradation. A positive coefficient is associated with an increase of the module’s KOs in D7, whereas a negative coefficient is associated with a decrease. The coefficients/differentials of the KOs computed by songbird are plotted on the x-axis (thin bars). The thick bar is the origin of the x-axis.
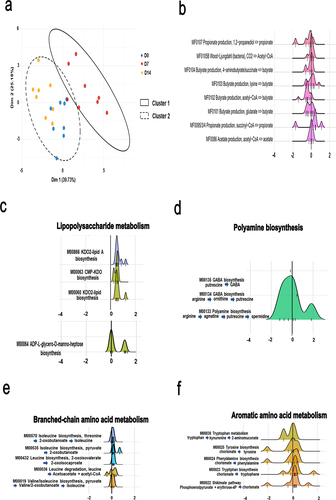
Figure 4. Alteration in blood metabolite production during an IAV infection. (a–e), L-carnitine and short-chain acetylcarnitines (a), TMAO (b), indole derivative (c), polyamine (d), and branched short-chain fatty acids (e) were measured in blood samples from each animal and at each time point, using targeted quantitative metabolomics (mean ± SD). Values for individual animal are presented (n = 7–8/time point) (µM). Significant differences were determined using one-way ANOVA test followed by Tukey’s multiple comparison test to parametric data. Nonparametric data was analyzed by Kruskal – Wallis ANOVA with Dunn’s posttest (*p < .05, **p < .01, ***p < .001). TMAO, trimethylamine N-oxide; IPA, indole-3-propionic acid; IAA, indole-3-acetic acid.
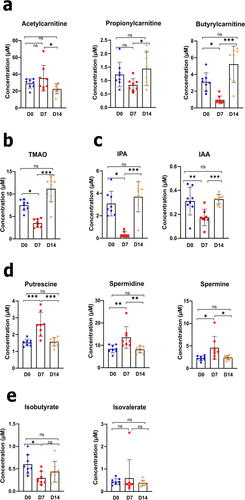
Figure 5. Associations between taxonomic and metabolomic features from non-infected and IAV-infected animals. (a), Hallagram representation for metabolites associations with microbial taxa. Metabolites shown in figure 6 were analyzed. Spearman correlation was used as similarity metric, with negative values represented in blue and positive values represented in red. Significant blocks were numbered in descending order of significance. (b and c), correlations between bacterial metabolites (b) and taxa (c) and infection-related variables. a–c, only taxa differentially represented between mock-infected and IAV-infected mice were taken into account. The false discovery rate (FDR) was controlled using the Benjamini-Hochberg method with alpha 0.05 and the expected false negative rate (FNR) for block associations was the default 0.2. (d), network of correlations between metabolites, taxa, and infection parameters. The shape and color of nodes indicate the group of data (metabolites, taxa, or infection parameters). Edges colors indicate the correlation coefficient (blue for negative and red for positive), whereas edge thickness is proportional to significance (thicker lines indicate lower adjusted p-values). Only associations with adjusted p-value ≤0.05 and correlation coefficient ρ ≥ |0.15| were included. Inset, Subnetwork of direct associations with IPA. Arg, arginine; his, histidine; Tyr, tyrosine; Trp, tryptophan; C0, carnitine; C3, propionylcarnitine; IPA, indole-3-propionic acid; C4, butyrylcarnitine; TMAO, trimethylamine N-oxide.
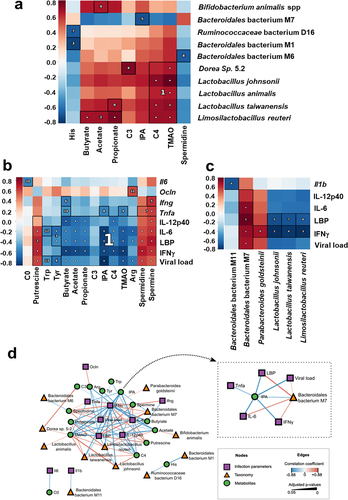
Table 2. Significative clusters identified with HAllA for taxonomy and metabolomics data. Shifts in species abundances are indicated inside parenthesis.
Table 3. Significative clusters identified with HAllA for taxonomy and infectious diseases parameters data. Shifts in species abundances are indicated inside parenthesis.
Table 4. Significative clusters identified with HAllA for infection parameters and metabolomics data.
Figure 6. Effect of IPA treatment on viral load and inflammation during influenza infection. (a), left panel, schematic procedure. Mice were daily treated by oral gavage with vehicle (0.5% methyl cellulose in sterile water) or IPA (40 mg/kg/day) on D1 until D6. Mice were sacrificed on D7. right panel, systemic concentration of IPA in vehicle-treated and IPA-treated IAV-infected mice. Non-infected (mock) mice were used as controls. Errors indicate mean ± SD (n = 8). (b), percentage loss relative to initial body weight. Errors indicate mean ± SD (n = 22–24, pool of three independent experiments). (c), body temperature (n = 8). (d), left panel, quantification of viral load in the whole lung using specific TaqMan RT-qPCR. Data are expressed as genome copy number (M1 protein)/μg RNA. right panel, viral protein labelling (immunofluorescence) was performed on lung sections collected at 7D. Bars: 25 μm. (e and f), mRNA copy numbers were quantified by RT-qPCR. The data are expressed as the mean of change relative to average gene expression in non-infected animals. (g), serum proinflammatory cytokines and markers of altered intestinal barrier were quantified by ELISA. (d-g). Errors indicate mean ± SD (n = 7–16, two pooled experiments). Significant differences were determined using using the Kruskal-Wallis test (a) or the Mann Whitney U test (b-g) (*p < 0.05; ** p < .01, *** p < .001).
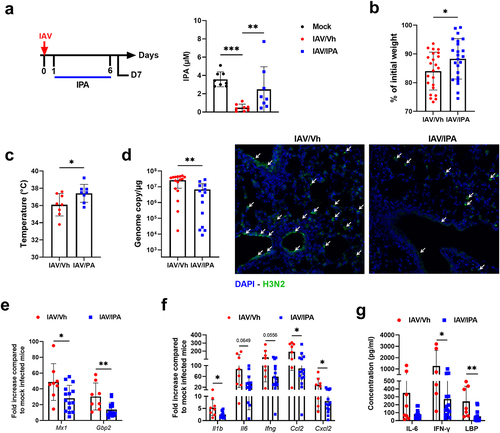
Figure 7. Role of IPA-producing bacteria in the control of viral load and inflammation. (a), left panel, schematic procedure. Mice were treated with vancomycin and ampicillin 5 days prior to the onset of infection until D2. Mice were sacrificed on D4. middle panel, systemic concentration of IPA, ILA and IAA in antibiotic-treated mice. right panel, schematic showing the conversion pathway of tryptophan into different bioactive indole metabolites including those that require the gut microbiota for conversion. (b), quantification of viral load in the whole lung using specific TaqMan RT-qPCR. Data are expressed as genome copy number (M1 protein)/μg RNA. (c and d), the same parameters (a and b) were measured by this time after supplementation, or not, with IPA (oral gavage, 40 mg/kg/day, from one day before infection to D3). (e), left panel, experimental procedure. Mice were daily treated or IPA one day before infection until D3. Mice were sacrificed on D4. middle and right panels, viral load and gene expression were quantified by RT-PCR. For all graphs, errors indicate mean ± SD. a-d and e, right panel, one experiment out of two is depicted (n = 6–8). e, left panel, a pool of two experiments is depicted (n = 13–14). Significant differences were determined using the Mann Whitney U test (*p < .05; ** p < .01).
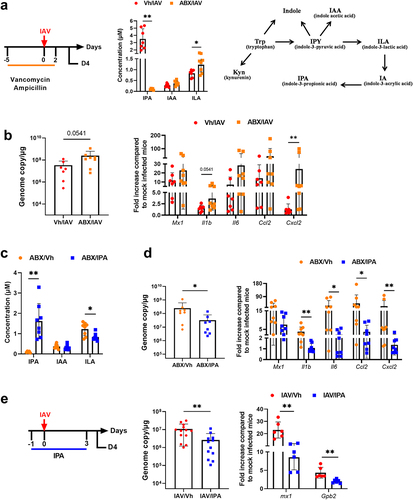
Table 5. Sequences of the oligonucleotides usedin this study
Supplemental Material
Download Zip (4.4 MB)Data availability statement
The sequence datasets generated in this study are publicly available at https://www.ncbi.nlm.nih.gov/bioproject/PRJNA908759 and https://www.ncbi.nlm.nih.gov/bioproject/PRJNA105451. iMGMC (https://zenodo.org/record/3631711 and https://github.com/tillrobin/iMGMC). The file used was called “GeneID,” and the KOs annotations are available from the github (KEGG KofamScan 03/20). Reference genome (for decontamination): Assembly GCF_000001635.26, available at https://www.ncbi.nlm.nih.gov/assembly/GCF_000001635.26/.