
Figures & data
Figure 1. IAA alleviates DSS-induced colitis in mice.
(a) Experimental design. Relative mRNA expression of inflammatory factors and mucosal protective factors in colon tissue. (b) Percentage change of body weight during the whole experimental time. (c) Disease activity index evaluated at sacrifice. (d – e). Representative images and length of the colon. (f – g) the image of H&E staining of the colon and pathological score. (h) Relative mRNA expression of inflammatory factors in colon tissue. (i) the proportion of CD45+ CD4+ IL17A+ Th17 cells and CD45+CD4+Foxp3+ Treg cells in colon tissue. (j) Relative mRNA expression of mucosal protective factors in colon tissue. (k) The immunohistochemistry staining of MUC2 protein and Claudin protein in colon tissues.
Data are expressed as mean±SE, n = 5-12,*p<0.05,**p<0.01.
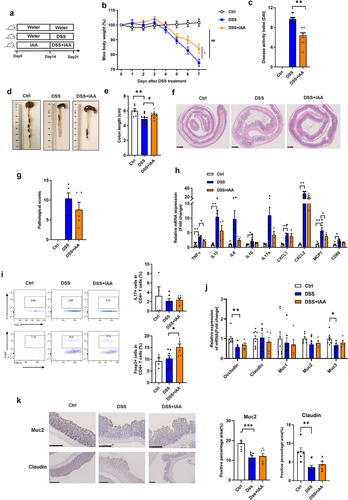
Figure 2. IAA alleviates DSS-induced colitis in mice through gut microbiome.
(a – c) the α-diversity of gut microbiome in fecal content. (d) Experimental design. (e) Percentage change of body weight during the whole experimental time. (f) Disease activity index evaluated at sacrifice. (g – h) Representative images and length of the colon. (i – j) the image of H&E staining of the colon and pathological score. (k) the relative abundance of species in fecal content of DSS+AB and DSS+AB+IAA group. (l – n) the alpha diversity in fecal content of DSS+AB and DSS+AB+IAA group.
Data are expressed as mean±SE, n = 6-10,*p<0.05,**p<0.01.
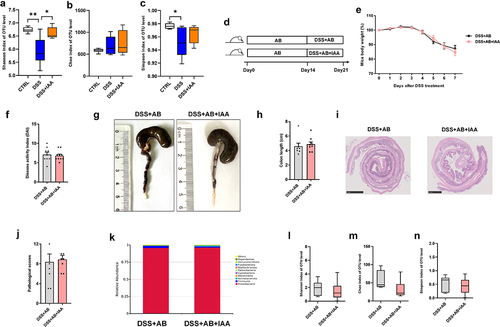
Figure 3. Bifidobacterium pseudolongum ATCC25526 alleviates DSS-induced colitis through increasing the Foxp3+T cells.
(a) The LEfSe differential analysis of gut microbiome between DSS(DS) and DSS+IAA (DI) group.(b) Experimental design.(c) Percentage change of body weight during the whole experimental time.(d) Disease activity index evaluated at sacrifice.(e – f) Representative images and length of the colon.(g) the image of H&E staining of the colon and pathological score.(h) the proportion of CD45+ CD4+ IL17A+ Th17 cells and CD45+CD4+Foxp3+ Treg cells in colon tissue.(i) the level of IL10 and IL17 in serum and colon tissue.
Data are expressed as mean±SE, n = 3-13,*p<0.05,**p<0.01,***p<0.001
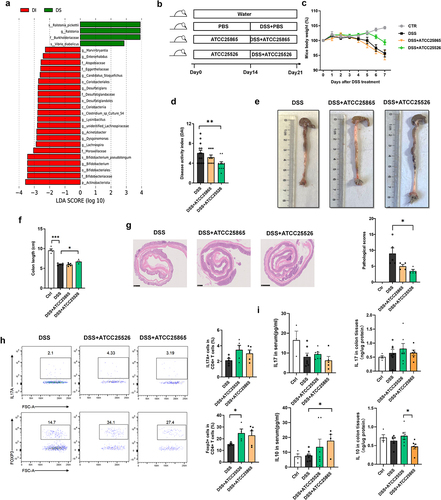
Figure 4. R-equol alleviates DSS-induced colitis through increasing the Foxp3+T cells.
(a) the volcano plot of differential metabolites and the level of R-equol in fecal contents between DSS+ATCC25526 and vehicle group. (b) Experimental design. (c) Percentage change of body weight during the whole experimental time. (d) Disease activity index evaluated at sacrifice. (e) Representative images and length of the colon. (f) the image of H&E staining of the colon and pathological score. (g) the proportion of CD45+ CD4+ IL17A+ Th17 cells and CD45+CD4+Foxp3+ Treg cells in colon tissue. (h) the level of IL10 and IL17 in serum.
Data are expressed as mean±SE, n = 4-11, **p<0.01,***p<0.001
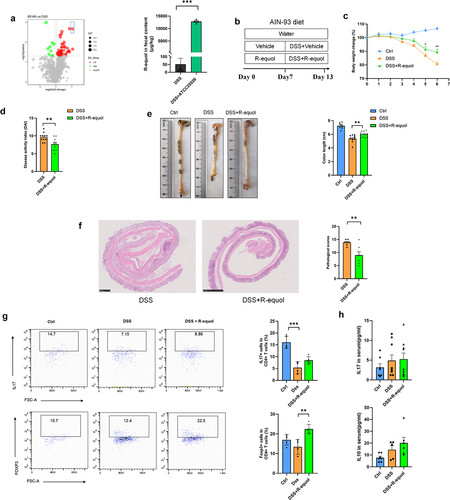
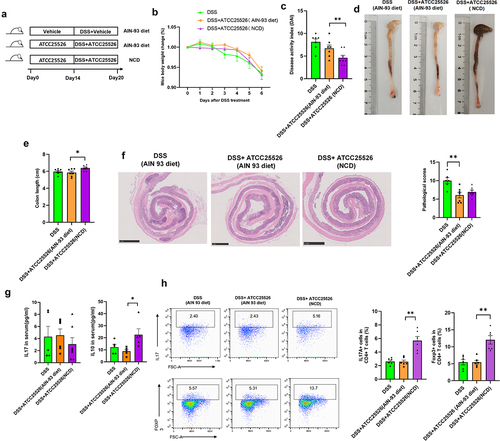
Figure 5. Bifidobacterium pseudolongum ATCC25526 alleviates DSS-induced colitis through increasing the Foxp3+T cells by R-equol.
(a) Experimental design (NCD normal chow diet). (b) Percentage change of body weight during the whole experimental time. (c) Disease activity index evaluated at sacrifice. (d – e) Representative images and length of the colon. (f) the image of H&E staining of the colon and pathological score. (g) the level of IL10 and IL17 in serum. (h) the proportion of CD45+ CD4+ IL17A+ Th17 cells and CD45+CD4+Foxp3+ Treg cells in colon tissue.
Data are expressed as mean±SE, n = 5-8,*p<0.05,**p<0.01.
Supplemental material