
Figures & data
Figure 1. Analyses of the sap coding region and gene deletion strategy. (a) the sap coding region, which is located at the twentieth open reading frame (orf) within the she pathogenicity island, was analyzed using previous RNA-sequencing gene expression data.Citation6 RNA was extracted from S. flexneri 2457T cultures grown in TSB with and without bile salts under both shaking and static growth conditions, each with technical duplicate cultures (A and B). The RNA-seq trace read data were generated using the integrative viewer (IGV) software (version 2.14). There were no significant expression changes in the sap gene in the different growth conditions. The corresponding sap coding region is provided at the bottom of the diagram, and the gap in sequencing corresponds to the annotated stop codon at position 894. (b) Comparison of the sap gene sequence with the Ag43 flu gene sequence of E. coli Citation14 indicated 99% identity of the signal sequence (nucleotides 1–156), the passenger domain (nucleotides 157–1,656) and the β-barrel domain (nucleotides 1,657–3,120). The only sequence difference is the stop codon at position 894 in the S. flexneri 2457T sequence. The lambda red linear recombination method was used to replace the 5’ region of the sap gene, specifically the signal sequence and the passenger domains (1.7 kb), with a kanamycin resistance cassette. The mutation was confirmed by PCR analysis of the wild type and ∆sap kanamycin resistant colonies.
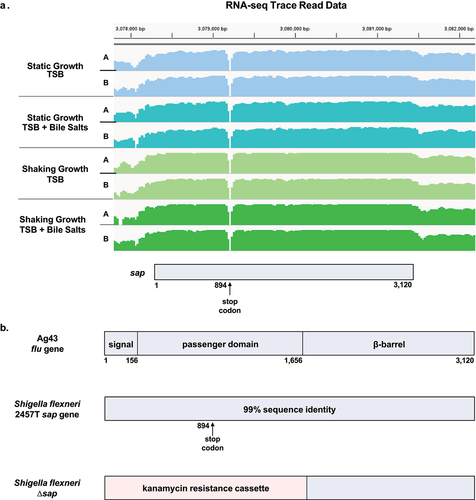
Table 1. The presence of the sap gene in the global collection of S. flexneri isolates (GEMS).
Figure 2. Bacterial cell aggregation and biofilm formation analyses. Overnight cultures of S. flexneri wild type strain 2457T and the Δsap mutant were standardized and inoculated into different media formulations at 1:50 dilutions, either LB supplemented with glucose (glu) and/or bile salts (BS) or TSB supplemented with bile salts, and subcultured. All data are plotted as the average of three biological independent experiments, ± the standard error of the mean. (a) To measure bacterial cell aggregation prior to EPS matrix formation, subcultures were grown in shaking conditions until growth reached an OD600 of 0.7. Bacterial cultures were then centrifuged, resuspended in 2 ml of 1X PBS, and placed on the benchtop for 18 h. The OD600 was measured 0.5 cm from the top of the supernatants at the beginning (time 0) and after the 18 h incubation. Bacterial cell aggregation was measured as the final OD600 readings at 18 h subtracted from the initial OD600 readings for each condition. No significant differences were detected in any of the conditions tested. (b) To measure bacterial cell aggregation after EPS matrix formation, subcultures were grown as noted above for 4 hours in TSB with and without bile salts supplementation. While there was no autoaggregation in 2457T or the Δsap mutant in TSB, both strains aggregated in TSB + BS (p < 0.01 for all time points), and the Δsap mutant aggregated quicker compared to 2457T (p ≤0.001 for all time points). Analyses were performed in LB + glu ± BS and the same results were obtained, but the higher glucose concentrations resulted in the Δsap mutant aggregating within five minutes (data not shown). (c) Biofilm formation was monitored every 30 minutes between hours 2 to 4 of incubation to capture the early phase of formation. There were significant increases in the biofilm formation in all media containing both glucose and bile salts in 2457T and the Δsap mutant (p < 0.005) as indicated by the asterisks. EPS matrix production started at 2.5 hours for LB + glu + BS and at 3.0 hours for TSB + BS in which the delay is due to the lower glucose concentration. There were no significant differences between 2457T and the Δsap mutant.
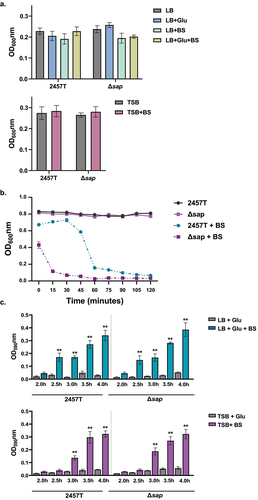
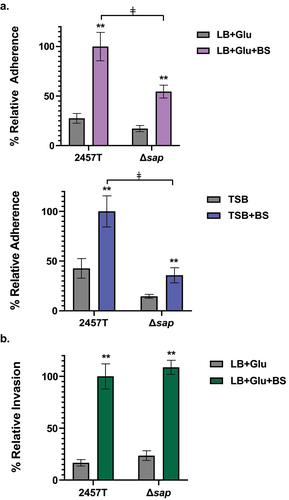
Figure 3. Analysis of the ∆sap mutant in adherence to and invasion of HT-29 epithelial cells. Infection analyses were performed following bacterial subculture in LB media supplemented with glucose (glu), with or without bile salts (BS), as well as TSB media with or without bile salts. The average percent recoveries ± standard error of the mean from three biological replicates are plotted relative to the recovery rate for 2457T from the bile salts subcultures (set at 100%). (a) In adherence assays following subculture in either LB + glu ± BS or TSB ± BS, the adherence rates were induced for both wild type 2457T and the Δsap mutant following bile salts exposure (**, p < 0.005). However, the Δsap mutant had lower adherence following subculture in bile salts compared to 2457T in the same condition (ǂ, p < 0.005). There were no significant differences in adherence between 2457T or the Δsap mutant following subculturing in media without bile salts. While there is a decrease in adherence in the Δsap mutant relative to 2457T following TSB subculture without bile salts, the difference was not statistically significant. (b) For invasion, there were no significant differences between 2457T and the Δsap mutant following subculture in LB + glu ± BS. Both strains had significant increases in invasion following exposure to bile salts (**, p < 0.005).
Data availability statement
The authors confirm that data supporting the findings of this study are available within the article or upon request from the corresponding author.