
Figures & data
Figure 1. Characterization of K. aerogenes SK431 genome. (a) Phylogenetic tree of Ka SK431 and 18 reference Ka strains. (b) Presence of virulence-associated genes in indicated strains of Ka; Escherichia coli (Ec); K. pneumoniae (Kp); Citrobacter rodentium (Cr). The presence and absence of operon orthologues are indicated by yellow and black, respectively. (c) Schematic representation of the “locus of colonization in the inflamed gut” (LIG) virulence factors in SK431 and other Klebsiella strains. Syntenic regions and gene orthologues are indicated by the same arrows and background colors. The genes of uncharacterized proteins are shown in white arrows. Direction of arrows indicates the transcriptional direction. The locus numbers in gene-annotated genomes (GenBank accession numbers, CP028951, NC015663, 000364385, 900478285, 000240325 for Ka AR0161, Ka KCTC2190, Kp ATCC BA2146, Ko NTCC 11,355, Km KCTC1686, respectively) are indicated below the respective first and last genes of each syntenic region.
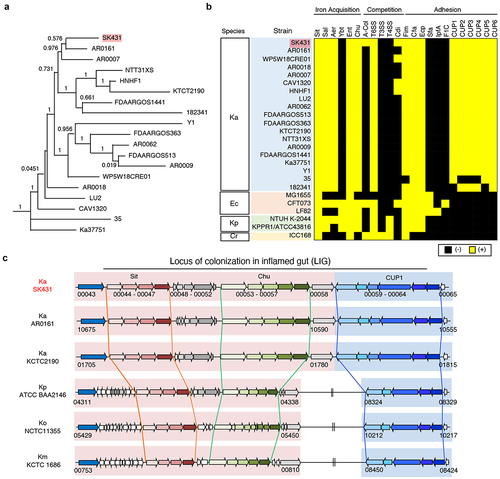
Figure 2. Experimental design and overview of genes required for the colonization in the steady state and the inflamed oral and gut mucosae. (a) A transposon (tn) mutant (mut) library of Ka SK431 was inoculated into specific pathogen-free (SPF) C57BL/6 mice by soaked ligature and orogastric gavage for the oral and gut sites, respectively (input: IN). Ligature and feces were collected from the healthy control mice and the inflamed (periodontitis or colitis) mice on indicated days after inoculation (output). DNA was isolated from the input and output samples and sequenced by Illumina NovaSeq. The resulting reads were mapped to the Ka SK431 genome, and the abundance of reads at each insertion site from all output samples were compared to those for the input samples to determine a fold-change value for each gene. (b) Genome-wide distribution and frequency of mutations in the library. Individual tn densities per kilobase gene per million reads (TnPKM) are shown as dots on the map of Ka KCTC2190 complete genome, instead of incomplete SK431 genome. Red line, 3,000 gene moving average of IN. (c) Number of genes that were required for the colonization in the indicated locations and conditions. The log ratio of the average TnPKM of indicated group a per group B for individual genes is shown on the X-axis. The accumulation curves of the number of the gene from the top (rich in group B) to the bottom (rich in group A) are shown on the Y-axis. (d) Graph summarizing the results of (C).
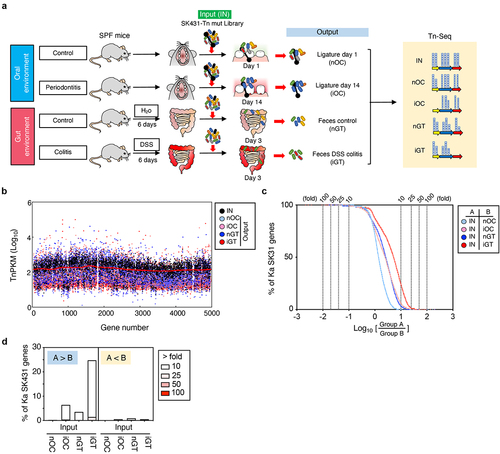
Figure 3. Functional pathways required for the colonization in the oral and gut mucosae. The genes were grouped in functional categories and an SNR analysis was performed using input/output ratios of TnPKM sums (left). The heatmap (right) shows the transposon mutant gene abundance (log10 averaged TnPKM, n = 4 to 6 mice) in the input (IN), the inflamed oral cavity (iOC), and the inflamed gut (iGT). The positive values of SNR indicate more in input. *, statistically significant TnPKM ratio (fold differences > 10, absolute SNR (|SNR|) > 5, p < 0.05, FDR < 0.05). AA, amino acid; TnPKM, transposon (tn) densities per kilobase per million mapped reads; SNR, signal-to-noise ratio; FDR, false discovery rate.
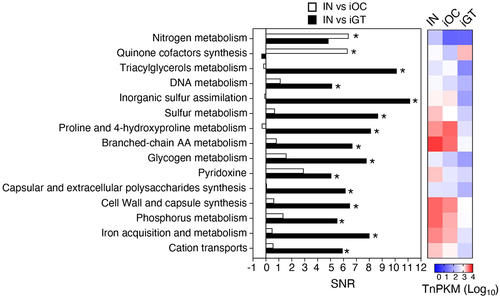
Figure 4. Virulence genes required by K. aerogenes SK431 for colonization in differential mucosal sites. The relative tn abundance (log10TnPKM, left) and signal-to-noise (input to output) ratio (SNR, right) of virulence gene mutants of indicated groups are depicted in heatmaps. The gene IDs of each operon are listed. T6SS1 and T6SS2 represent two core operons of T6SS. [Left; TnPKM]: higher gene abundance is indicated in red, while lower abundance is shown in blue. [Right; SNR]: genes required in input (IN) condition are indicated in yellow. Genes required in output conditions are shown in red. *, genes with significant differences (fold differences > 10, |SNR| > 0.5, FDR < 0.05, p < 0.05).
![Figure 4. Virulence genes required by K. aerogenes SK431 for colonization in differential mucosal sites. The relative tn abundance (log10TnPKM, left) and signal-to-noise (input to output) ratio (SNR, right) of virulence gene mutants of indicated groups are depicted in heatmaps. The gene IDs of each operon are listed. T6SS1 and T6SS2 represent two core operons of T6SS. [Left; TnPKM]: higher gene abundance is indicated in red, while lower abundance is shown in blue. [Right; SNR]: genes required in input (IN) condition are indicated in yellow. Genes required in output conditions are shown in red. *, genes with significant differences (fold differences > 10, |SNR| > 0.5, FDR < 0.05, p < 0.05).](/cms/asset/d9a532b5-2606-4797-a82f-5c64dfb48bda/kgmi_a_2333463_f0004_oc.jpg)
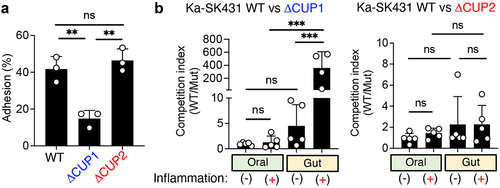
Figure 5. CUP1 genes are required for the ectopic colonization of K. aerogenes in the inflamed gut. (A) Ka SK431 WT, CUP1, or
CUFP2 strains were co-cultured with human colonic epithelial cell line T84 for 3 hours. T84 cells were then washed, and adherent bacteria were cultured on LB plates. The percentages of adherent bacteria relative to inoculum are shown. (B) For the oral niche, WT and mutant (
CUP1 or
CUP2) Ka SK431 strains were co-inoculated into SPF C57BL/6 mice by soaked ligature. Inserted ligatures were harvested on day 1 (inflammation-) or day 14 (inflammation+). CFUs of colonized strains were measured by plating in selective media. For the gut niche, WT and mutant Ka SK431 strains were co-inoculated into SPF B6 mice (naïve and DSS day 5) by oral gavage. Inoculated bacterial strains were then harvested 3 days post-challenge. The competition indexes (Wt/mutant) are shown. Results are the mean ± SD. ns; not significant, **; p < 0.01, ***; p < 0.001 by 1-way ANOVA with Bonferroni post hoc test.
Supplemental Figures.docx
Download MS Word (561.6 KB)Data availability statement
The data that support the findings of this study are available from the corresponding author, NK, upon reasonable request. The Klebsiella aerogenes SK431 genomic sequence, Tn-Seq data used in this study are available from the BioProject website (https://www.ncbi.nlm.nih.gov/bioproject/), accession numbers PRJNA763502.