Figures & data
Figure 1. Analysis of fecal microbiota from healthy and CD patients and selected samples for mouse colonization.
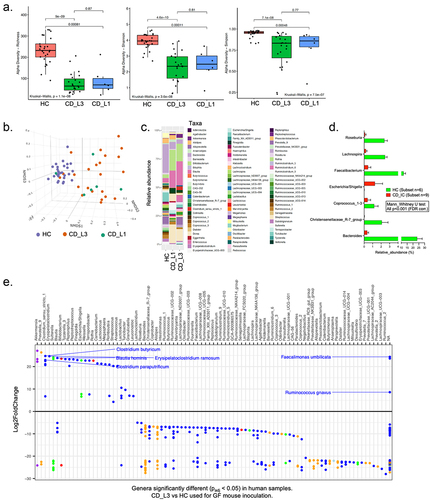
Figure 2. Analysis of the established microbiomes in GF mice humanized with HC and CD_L3 fecal samples.
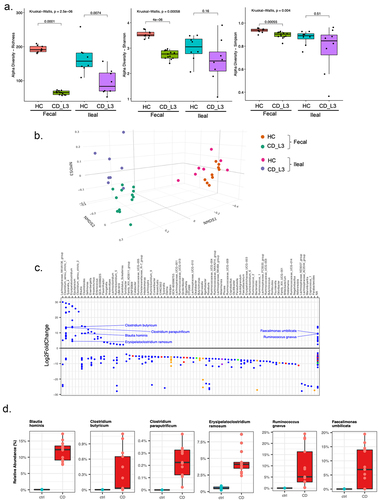
Figure 3. Histological features of mild to moderate colitis in xGF mice humanized with HC and CD_L3 fecal microbiota.
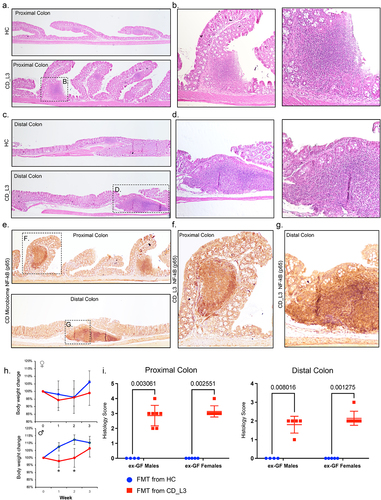
Figure 4. Inflammatory signature of the colonic transcriptome profiling of xGF mice humanized with HC and CD_L3 fecal microbiota.
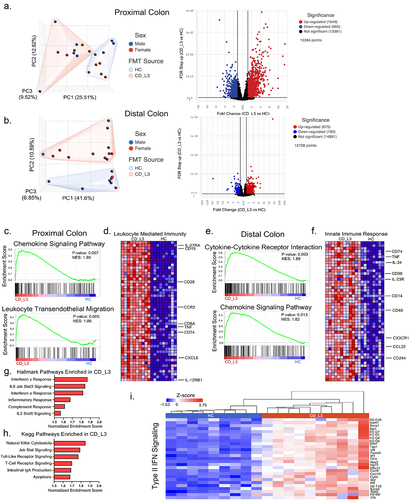
Figure 5. The colonic transcriptomic profile of CD_L3 recipients shows an enrichment in the IBD pathway.
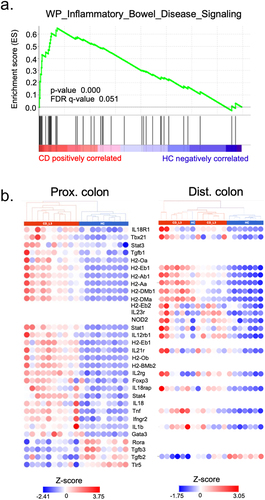
Figure 6. Increased T-cell infiltration and increased expression of epithelial CD74 and CD14 in the inflamed colonic mucosa of xGF mice humanized with HC and CD_L3 fecal microbiota.
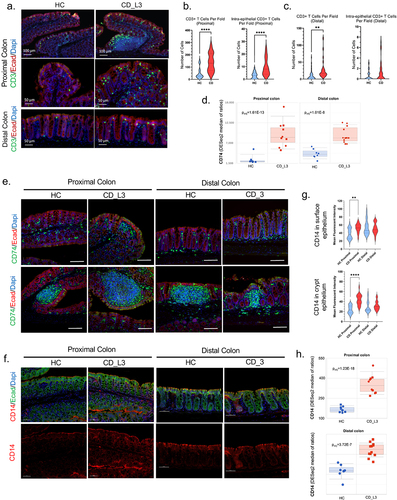
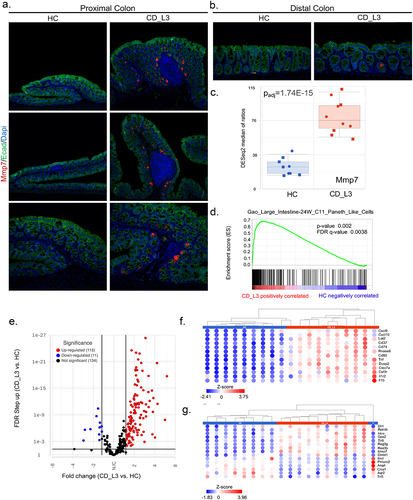
Figure 7. Paneth cell-like signature in the proximal colon of xGF mice humanized with HC and CD_L3 fecal microbiota.