
Figures & data
Table 1. Characteristics of the study population of 80 children and adolescents undergoing HCT.
Table 2. Prevalence of antibiotic exposures among the study population and fecal samples collected after antibiotic exposures.
Figure 1. Microbiome composition over time relative to HCT. a. Principle coordinate analysis of Bray-Curtis distances for microbiome composition at weeks − 2, 0, +3, and + 7. These timepoints correlate to clinically-relevant periods relative to HCT, specifically pre-transplant, time of HCT, peri-engraftment, and post-engraftment. Each dot represents a single sample; the circles represent clustering of samples by timepoint. b. Relative abundances of highly abundant bacterial species in fecal samples of children by week relative to hematopoietic cell transplantation (HCT). Escherichia coli, Enterococcus faecalis, and phocaeicola vulgatus (formerly bacteroides vulgatus) were the most abundant bacterial species. The relative abundances of several anaerobic species (e.g., Bifidobacterium longum, faecalibacterium prausnitzii, parabacteroides distasonis) declined over time, whereas the relative abundances of potential pathogens (e.g., E. faecalis, Klebsiella pneumoniae) increased after HCT.
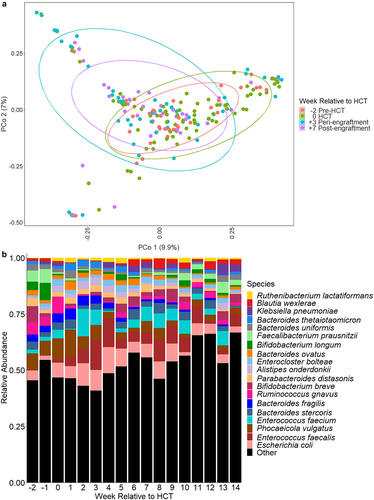
Figure 2. Heatmap depicting associations between antibiotic exposures and other clinical factors and gut microbiome composition. Associations were estimated from linear mixed effects models fit using MaAsLin2. We included bacterial species with a minimum mean relative abundance of 1% and a sample prevalence of 5%; the false discovery rate was set to 0.1. Broadly, there were declines in the relative abundances of several bacterial species associated with antibiotic exposures. Notably, metronidazole and piperacillin-tazobactam exposures were associated with increases in the relative abundances of several enterococcal species. “Other” antibiotics includes exposures to tetracyclines, clindamycin, aminoglycosides, and non-cefepime beta-lactams. Betas indicate effect sizes and asterisks denote significant changes. Pip-tazo, piperacillin-tazobactam; TMP-SMX, trimethoprim-sulfamethoxazole; non-malignant heme, non-malignant hematologic disorder; non-myelo/RIC, non-myeloablative and reduced-intensity conditioning.
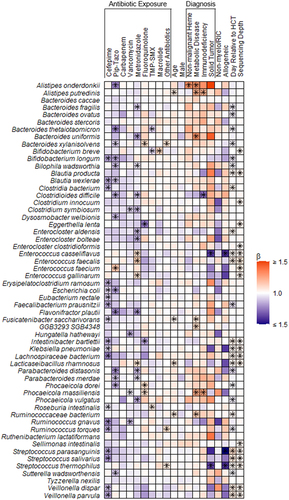
Table 3. Antibiotic resistance genes identified in fecal samples that may confer resistance to clinically relevant antibiotics.
Figure 3. Changes to the gut resistome and microbiome over time. a. Number of ARGs from the gut resistome and number of bacterial species from the gut microbiome in fecal samples by day relative to HCT; repeated measures correlation for the number of bacterial species and number of ARGs per sample. b. Number of new ARGs in the gut resistome and bacterial species in the gut microbiome by day relative to HCT; repeated measures correlation of the number of new bacterial species and ARGs since the previous sample. c. Jaccard distances for the gut resistome and microbiome by day relative to HCT; correlation of the Jaccard distances of the microbiome and resistome. Measures of the resistome and microbiome had similar trends over time and were moderately correlated when accounting for repeated measures. Jaccard distance values closer to one represent increased fluctuation. Points represent individual fecal samples; the smoothed lines were created using the Loess function, and shaded areas represent the 95% confidence intervals. The gut resistome is represented in blue, and the gut microbiome is shown in red. ARG, antibiotic resistance gene; HCT, hematopoietic cell transplantation; rrm, repeated measures correlation coefficient.
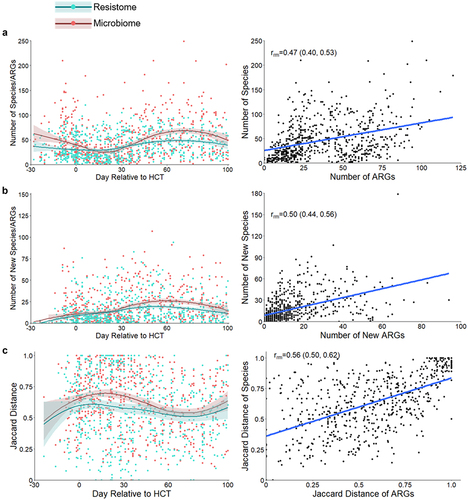
Figure 4. Effect of aerobic and anaerobic antibiotics on measures of the gut resistome. The effect of aerobic and anaerobic antibiotics is shown for the following measures of the gut resistome: the number of ARGs per sample, the number of new ARGs per sample, the abundance of ARGs, and gut resistome fluctuation, as measured by the Jaccard distance. All antibiotic exposures were associated with a decrease in the number of ARGs; however, only antibiotic exposures that included anaerobic antibiotics were associated with increases in the number of new ARGs acquired since the previous sample, the abundance of ARGs, and the fluctuation of the resistome. Points represent estimates, and error bars denote 95% confidence intervals. ARG, antibiotic resistance gene; TMP-SMX, trimethoprim-sulfamethoxazole; Pip-Tazo, piperacillin-tazobactam.
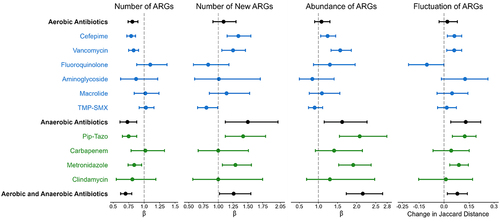
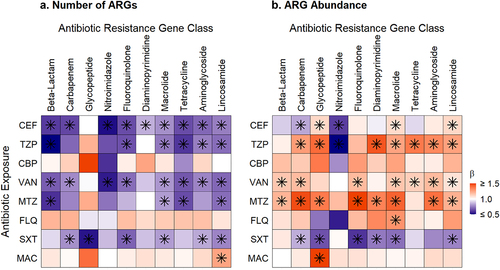
Figure 5. Heatmaps of associations between antibiotic exposures and ARGs conferring resistance to specific antibiotic classes. a. Antibiotic exposure effect on the number of ARGs for the exposure antibiotic class and others. b. Antibiotic exposure effect on the ARG abundance for the exposure antibiotic class and others. Broadly, exposure to an antibiotic of one class was associated with decreases in the number of ARGs and increases in the relative abundances of ARGs that confer resistance to several other classes of antibiotics. Beta values correspond to effect sizes from mixed effect models with individual antibiotic exposures as fixed effects and subject as a random effect. ARGs, antibiotic resistance genes, FEP, cefepime; TZP, piperacillin-tazobactam; CBP, carbapenem; VAN, vancomycin; MTZ, metronidazole; FLQ, fluoroquinolone; SXT, trimethoprim-sulfamethoxazole; MAC, macrolide. Tetracycline includes tetracycline and glycylcycline ARGs; beta-lactam includes cephalosporin, cephamycin, penam, and monobactam ARGs; lincosamide ARGs confer resistance to clindamycin; carbapenem includes carbapenem and penem ARGs; glycopeptide ARGs confers resistance to vancomycin; diaminopyrimidine ARGs confer resistance to trimethoprim; nitromidazole ARGs confer resistance to metronidazole. Asterisks denote significant change.
Supplemental Material
Download MS Word (262.5 KB)Data availability statement
The metagenomic data will be uploaded to the Sequence Read Archive prior to publication. The deidentified metadata and analytic script are also publicly available (https://github.com/smh114/Pediatric_HCT_Gut_Resistome).