Figures & data
Figure 1. Temporal evolution of brain injury after neonatal mouse H-I injury on serial T2-weighted MR images. Hyperintensity regions (arrowheads), indicative of edema, were apparent on serial imaging at 24 (A) and 72 h (B) after H-I insult. Hyperintensity regions were manually outlined in cortex (red), hippocampus (green), and striatum (blue). B.
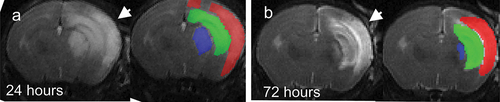
Figure 2. Edema volumes at 24 and 72 h after H-I. A,B – regional edema volume in cortex, hippocampus and striatum. C,D. Change of edema volume from 24 to 72 h after H-I. No difference was found between microbiota treatment groups in absolute or relative amount of edema volume change. *- significant difference between group means (ANOVA with Tukey-Kramer post-hoc tests).
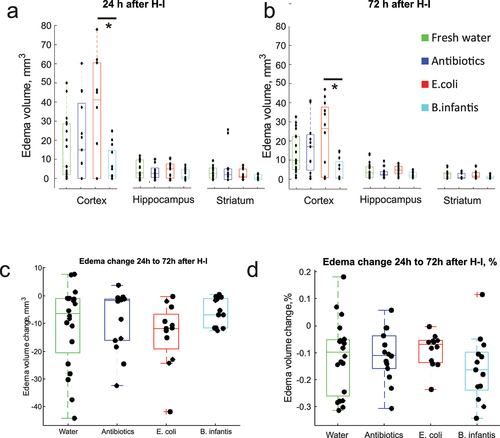
Figure 3. Pro-inflammatory cytokines gene expression before and after H-I across microbiota treatment groups. *-p < 0.05, ** - p < 0.01 on post-hoc tests.
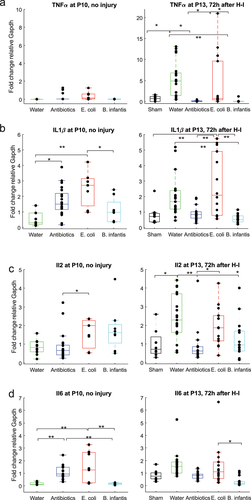
Figure 4. Anti-inflammatory cytokines gene expression before and after H-I in different microbiota treatment groups. *-p < 0.05, ** - p < 0.01 on post-hoc tests.
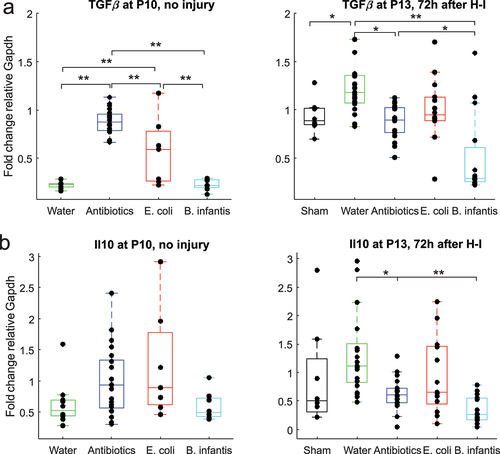
Figure 5. Pro-inflammatory cytokine IL1β increased proportionally with the extent of H-I injury. The linear regression slopes of the increase were significantly lower in antibiotic group relative to fresh water and E. coli groups, and even lower in B. infantis group.
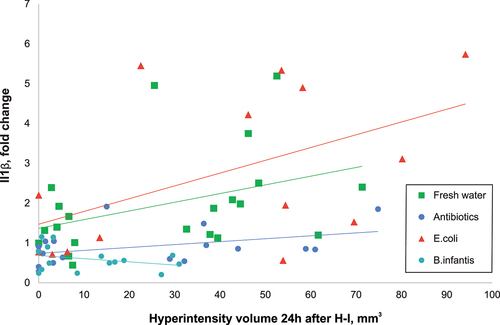
Figure 6. Gene expression of TLRs before and after H-I in different microbiota treatment groups. *-p < 0.05, ** - p < 0.01 based on post-hoc tests.
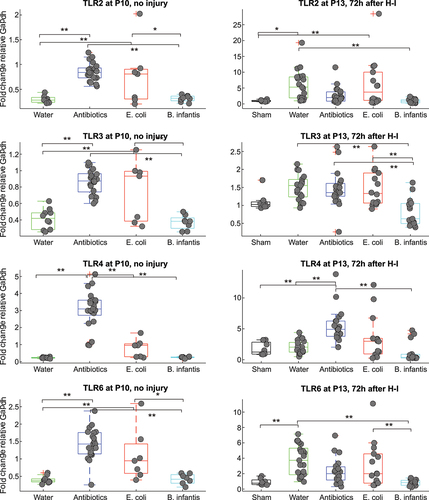
Figure 7. Activation of astro glia and microglia activation after H-I.
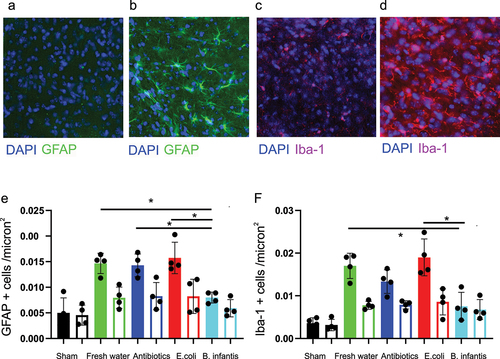
Figure 8. Small intestine injury after hypoxia – ischemia. Hematoxylin and eosin staining of terminal ileum of controls (A) and mouse pups in the fresh water group 72 h after H-I (B). Decreased thickness of lamina propria is indicated by arrows. Crypt depth (C) and villi density (C) were decreased after H-I in all microbiota groups. *- p < 0.05 post-hoc group comparisons with control group.
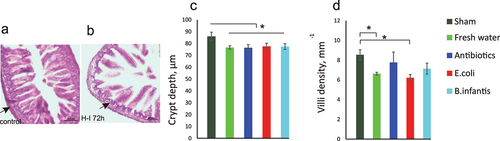
Figure 9. Cytokines serum concentrations before and after global hypoxia without carotid ligation. *-p < 0.05, ** - p < 0.01 on post-hoc tests.
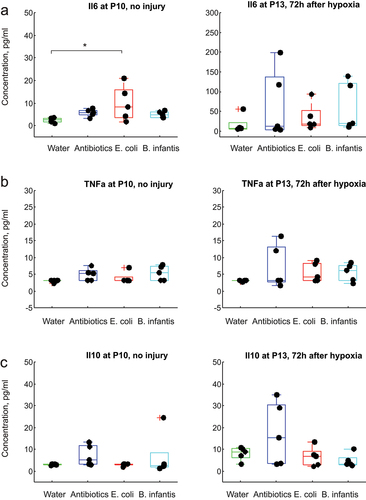
Figure 10. Indexes of mouse pup microbiome biodiversity after neonatal gavage transfaunation using 16S rRNA gene sequencing before H-I at P10. A. Beta diversity PCoA plots with bray-curtis dissimilarity measure, showing separation of gut bacterial communities with different microbial treatment. B. Shannon index of alpha-diversity was significantly lower in the Antibiotics group relative to fresh water group, but no difference between E. coli and B. infantis groups.
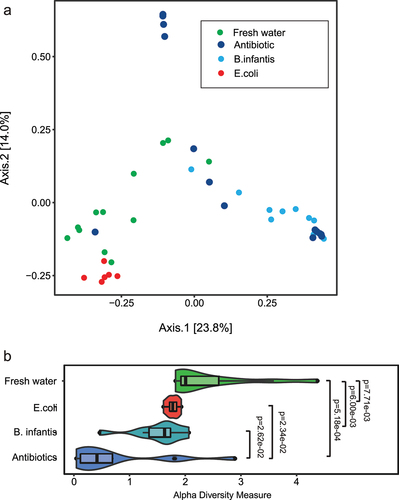
Figure 11. Taxonomic distribution in OTUs in colon samples obtained from mouse pups before (P10) and after IH (P13). The samples after H-I were sorted onto by the extent of brain injury.
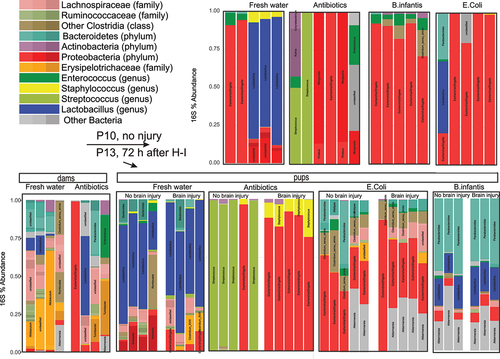
Figure 12. 16s abundance for the four most abundant phyla in colon samples in pups with and without brain injury at P13 after H-I.
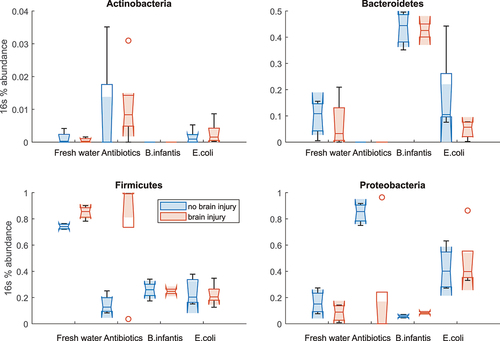
Figure 13. Time line of the experiments and experimental groups. The study groups are formed by a combination of two experimental factors: 1) microbial manipulation (fresh water, saline, E.Coli, B. infantis) and 2) hypoxia (normoxia, hypoxia, carotid ligation + hypoxia), at 2 time points. Each group had the same outcome measures, listed in the bottom row.