
Figures & data
Figure 1. Effects of SA and SA+Pro interventions on maternal and neonatal rats.
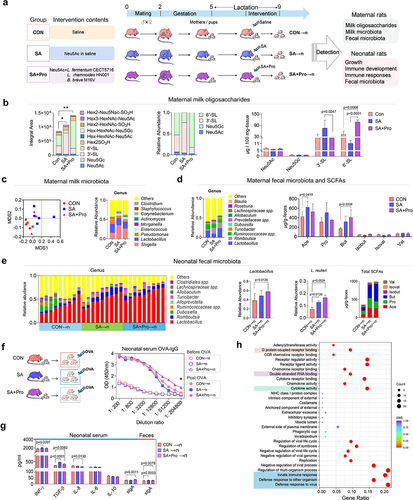
Figure 2. SA+Pro intervention in lactating St6gal1± (H) rats compromised allergic responses in neonates by regulating 6′-SL synthesis and the neonatal gut microbiota.
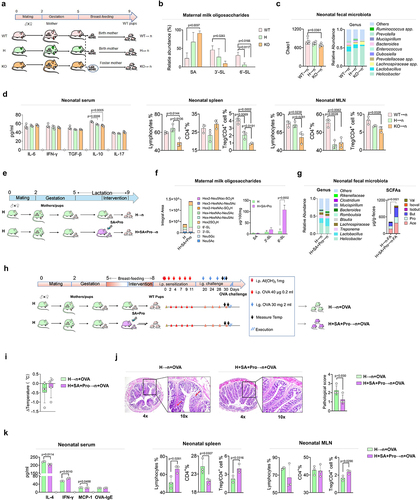
Figure 3. The Gpr41-PI3K-Akt-PPAR pathway was involved in regulating 6′-SL biosynthesis in mammary glands by SA+Pro.
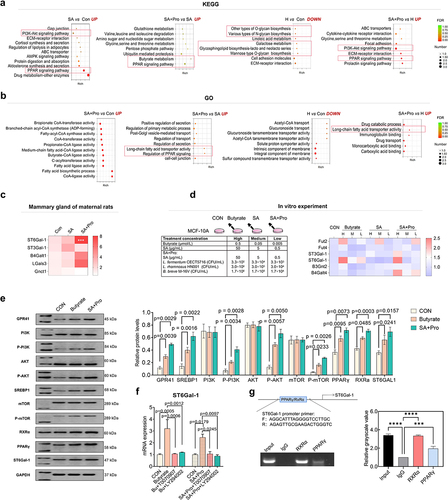
Table 1. Characteristics of the study participants.
Figure 4. Dynamics of the major HMO fractions and gut microbiota in participants.
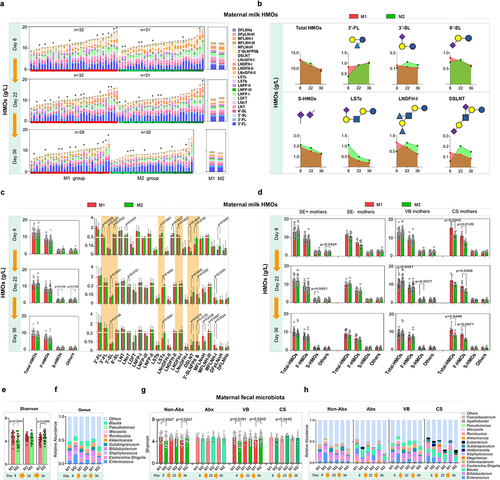
Table 2. Structures of the major HMOs.
Figure 5. Changes in the intestinal microbiota of infants fed by different mothers.
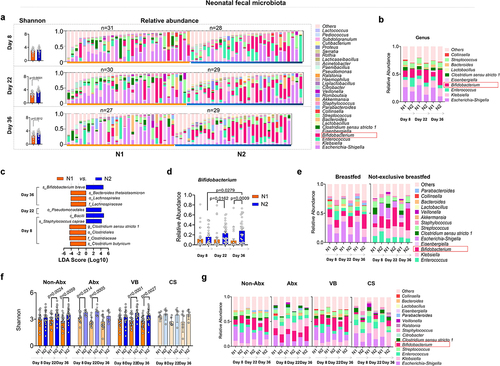
Figure 6. Analysis of data from the 20 paired mothers and infants.
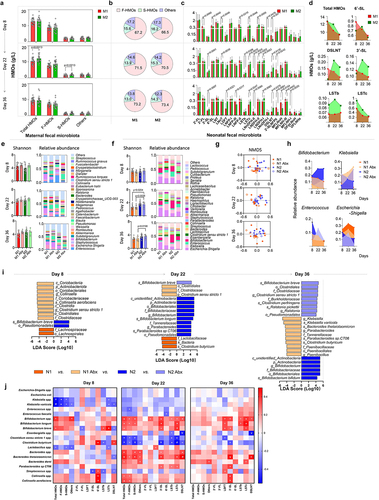
Table 3. Primers used for q-PCR detection of glycosyltransferase genes expressed in mammary epithelial cells.