
Figures & data
Figure 1. Histopathological analysis of pulmonary and GI tissues in rhesus monkeys challenged with SARS-CoV-2 or variants.
(a) Experimental design. Six rhesus monkeys were used in this study. Five monkeys were intranasally and intratracheally inoculated with SARS-CoV-2 Proto strain or indicated variants, respectively. One animal was treated with PBS as a negative control (NC). On the 5th day post treatment, all animals were euthanized and dissected for collection of GI contents, tissues of GI tracts, lung, and spleen, followed by evaluation of viral load, histological, transcriptomic or metagenomics analysis. Eventually, integrative analysis was conducted on the basis of phenotypes and omics. This figure was prepared via the online software figdraw (Copyright No. REG8221205045000212845). (b) Severity index of histopathology for the indicated tissues. The evaluation of severity index was described in Materials and Methods. (c) Apoptosis and proliferation of cells in indicated tissue samples were evaluated via immunohistochemical staining of the markers cleaved caspase-3 and KI-67. Ratio of staining density was calculated as described in Materials and Methods. Representative images were shown in Fig. S3A, B. (d) Mucosal barrier integrity of GI tract was evaluated by AB-PAS staining as described in Materials and Methods. Compared with the NC, significant differences in goblet cell count in GI tissues of variants of infected animals was indicated by One-way ANOVA. *(*p < .05, ** p < .01, *** p < .005, **** p < .001). Representative images were attached in Fig. S3C. (e and f) The epithelial integrity of the GI tract was determined via immunofluorescence staining of Zonula occludens protein (ZO-1) and epithelial cell adhesion molecule (EpCAM) as described in Materials and Methods. Representative images were shown in Fig. S3D.
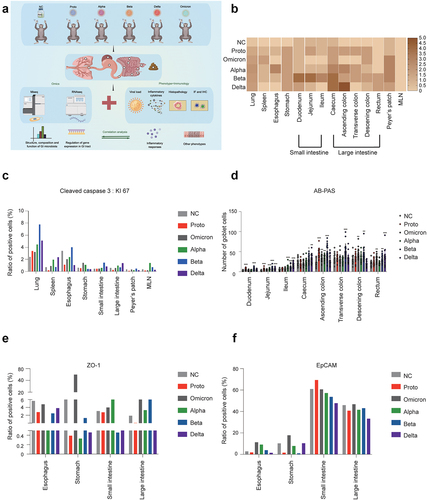
Figure 2. Inflammatory responses in GI tracts post SARS-CoV-2 proto strain or variants.
On 5 dpi, animals were euthanized and dissected. Tissues were collected for analysis of cytokines via the commercial kit as described in Materials and Methods. According to reported functions of cytokines, cytokines were divided into two panels, immunoregulatory (a) and inflammatory (b) cytokines. The highest cytokine level is set as 1 for normalization. The relative levels of cytokines were expressed in terms of color density in heatmaps. (c) Expressions of CD4 (left), CD8 (middle) and CD68 (right) in slides of indicated tissue samples were shown via heatmap of log2 fold change (infected monkeys vs NC) of staining index that was calculated as described in Methods. This figure was created via the GraphPad Software. Representative images were shown in Fig. S4.
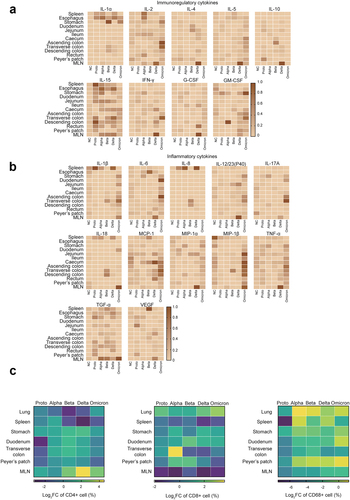
Figure 3. Microbial beta-diversity, composition and dominant microorganisms in GI contents of SARS-CoV-2 or variants infected animals.
On 5 dpi, animals were euthanized and dissected. GI contents from each fragment of the GI tract were collected for analysis of microbiota via 16S rRNA sequencing as detailed in Materials and Methods. (a) Principal coordinate analysis (PCoA) and partial least squares discriminant analysis (PLS-DA). The significant difference among clusters was analyzed via PERMANOVA (Permutational analysis of variance). R2 was used to interpret the degree of difference among groups. p < .05 means significant difference among groups. (b) Composition of GI microbes at the phylum level was plotted by Circos-0.67-7 (http://circus.ca/). The left half-circle ribbons outside and inside represent sample compositions and proportion of phyla, respectively. The right half-circle ribbons outside and inside represent distribution proportion of each phylum in group and relative abundance of the phylum in each group. (c) Difference of relative abundance of the phylum Spirochaetota among groups (Kruskal-Wallis H test; *p < .05; **p < .01; ***p < .005; ****<0.001). (d) Composition of GI microbes at the genus level. (e) The top 10 bacterial genera with significant difference in relative abundance (mean) among viral infection groups. (Kruskal–Wallis H test; *p < .05; **p < .01; ***p < .005; ****p < .001).
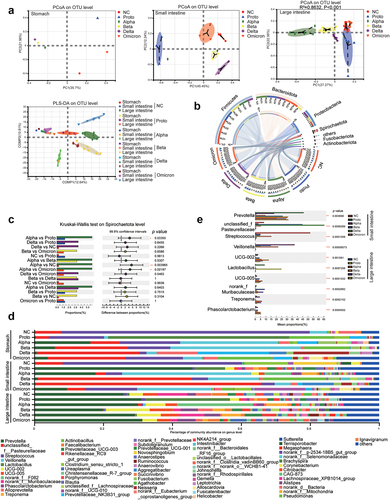
Figure 4. Prediction of microbial function and correlation analysis of tissue cytokines with microbiota in fragments of GI tract.
(a) Correlations between predicted function of GI microbiota and infections of viral strains. Left panel, heatmap shows functions involved in immunity and infection of the KEGG pathway at level 3 predicted via the online tool PICRUSt2. Relative levels of abundance were expressed by color density in the scale bar above (log values of metabolite richness. The middle panel and heatmap show a log2 fold change (infected monkeys vs NC) of metabolite richness (mean). The relative levels of log2 fold change were expressed by color density in the scale bar above, which was plotted by the software GraphPad prism 8. The right panel and heatmap show correlation analysis of function profile of GI microbiota with infections of viral strains. Levels of correlation were expressed by color density in the scale bar above. Significant difference was marked with * (* p < .05, ** p < .01, *** p < .005, **** p < .001). The figure was plotted via R pheatmap package. Correlations were evaluated using the spearman correlation coefficient. (b) Correlation analysis of tissue cytokines with GI fragments via db-RDA analysis on basis of microbiota (OTUs) in fragments of GI tract, which was plotted via R vegan rda package. (c) Correlation analysis of tissue cytokines with GI microbiota. Left panel, heatmap shows abundance of the phylum (left ribbon) and top 20 microbial genera in fragments of GI tract, plotted via R vegan package. Right panel, heatmap shows correlation of the top 20 microbial genera with tissue cytokines. The significance was marked with *(* p < .05, ** p < .01, *** p < .005, **** p < .001), which was plotted via R pheatmap package. Correlations were evaluated using the spearman correlation coefficient.
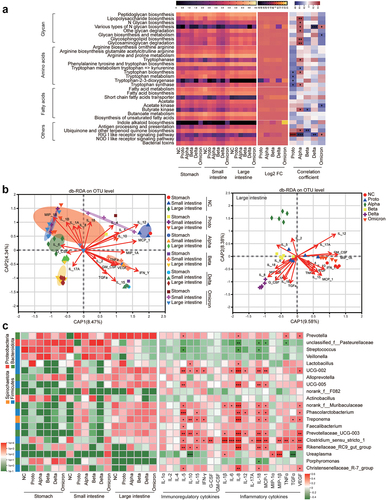
Figure 5. Transcriptomic profile of fragments in GI tract post SARS-CoV-2 or variants infection.
(a) Weighted gene co-expression network analysis (WGCNA) was performed to identify the top DEGs and their correlations with viral strains and fragments of the GI tract, following mRNA sequencing. Top panel, DEGs that were correlated with fragments of GI tract were clustered to form several modules as indicated (minModuleSize:30; minKEMtoStay:0.3; mergeCutHeight:0.25). Heatmap shows the module correlation of each gene (each row represents a GI fragment and each column represents a gene within the module). Correlation levels were differentiated by color (red means positive correlation and green means negative correlation). Middle panel, correlation of modules with specific phenotypes (GI segments). The numbers in the left column (modules) indicate the number of genes in the module. The numbers in the middle box indicate the correlation coefficient and p-value (in parentheses) between module and phenotype. Correlation levels were differentiated by color scale bar on the right (red for positive correlation and green for negative correlation). Bottom panel on the left, analysis of correlation matrix between the module genes (turquoise, yellow and brown) and GI tract. Levels of correlation were expressed by color density as shown in the scale bar. The significance was marked with * (*p < .0 5, **p < .01, *** p < .005, **** p < .001). Bottom panel on the right, heatmap of log2 fold change (infected monkeys vs NC) of values of module genes (mean). (b) Gene set enrichment analysis (GSEA) was conducted to identify leading edge genes as described in Materials and Methods. DEGs (NES >1.5 and p < .05) significantly enriched in MAP05332 (pathway associated with infection and immunity) were shown in plots, each of which represents an individual viral strain. Bottom panel on the right: heatmap shows log2 fold change of values (infected monkeys vs NC) of leading edge genes in MAP05332.
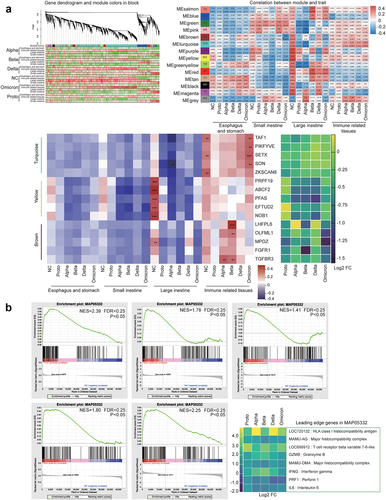
Table 1. Summary of pathogenic characteristics in two clusters of SARS-CoV-2.
Supplemental material