Figures & data
Figure 1. Predicted metabolic characterization of 136 microbiomes. (a-g) total metabolite secretion fluxes (mmol/person/day) predicted for the microbiomes of 67 UC and 69 non-IBD control samples for selected metabolites of interest.
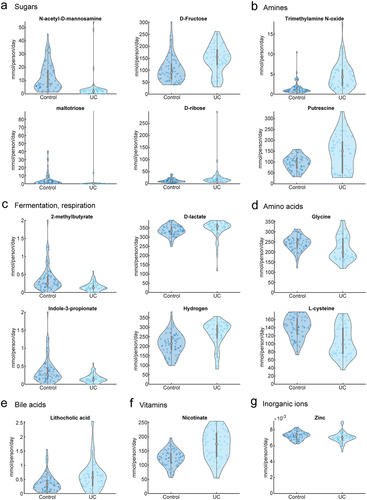
Figure 2. Strain-to-metabolite contributions computed for the 136 microbiomes. (a, b) circos plots on 4932 significantly different strain-to-metabolite contributions (mmol/person/day) summarized separately for the 69 non-IBD and 67 UC microbiomes, shown are the seven most prominent phylum-level contributions to all metabolites summarized by metabolite subsystem. Fi = Firmicutes, Ba = Bacteroidetes, Ac = Actinobacteria, Pr = Proteobacteria, Ve = Verrucomicrobia, Ca = candidatus melainabacteria, sy = synergistetes, Eu = Euryarchaeota.
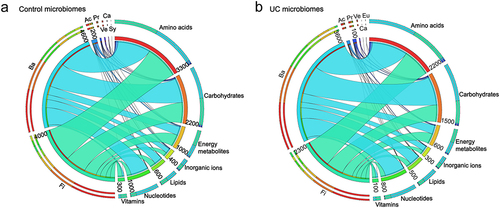
Figure 3. Feature selection and predictive performance evaluation. (a) Strains with feature importance greater than 0 based on RF, GBRT, XGB, XGBRF and LGB classifiers. (b) Metabolites with feature importance greater than 0 based on RF, GBRT, XGB, XGBRF and LGB classifiers. The effect on total prediction (based on SHAP values) is depicted for the 9 most predictive strains (c) and 12 most predictive metabolites (d) in XGBRF classifier, ranked in order of descending importance. Each data point denotes one sample, with coloration corresponding to the relative abundance of the specific strain or metabolite in that sample compared to all other samples. (e) Evaluating the impact on model prediction performance before and after feature selection based on accuracy (ACC) and Area Under Curve (AUC) indicators. M248, a total of 248 secreted metabolites; MI12, metabolite intersections with feature importance greater than 0 screened by 5 classifiers; S419, a total of 419 mapped strains; SI9, setabolite intersections with feature importance greater than 0 screened by 5 classifiers.
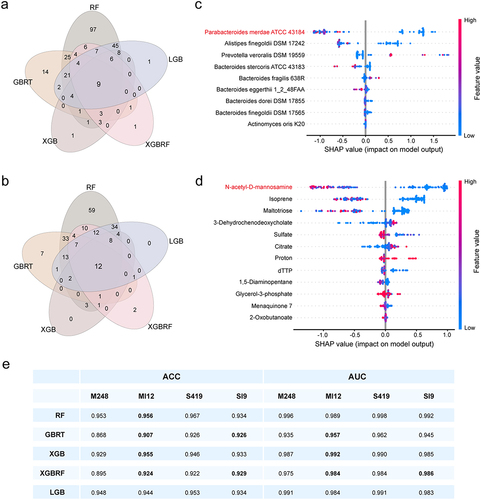
Figure 4. Spearman correlation analysis between metabolite secretion fluxes (mmol/person/day) and species relative abundances across all 136 microbiome models revealed 82 metabolites with correlation coefficients > 0.75 or < −0.75 with at least one bacterial species. These 82 metabolites, categorized by subsystem annotation, are displayed against the corresponding bacterial species, classified by genus and phylum.
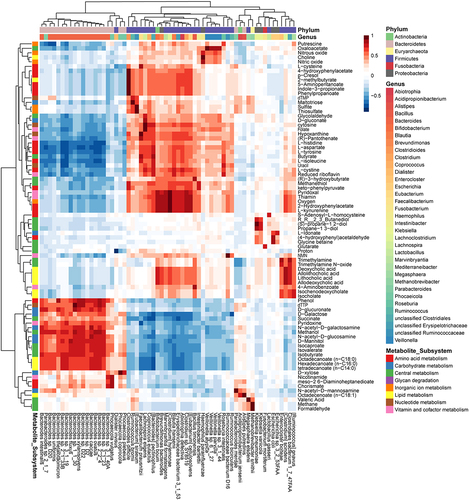
Figure 5. Effects of P.Merdae and ManNAc on DSS-induced UC mice. (a) Experimental design and grouping, color blue refers to sterile water, color pink refers to 3% DSS water. (b) Body weight (“modelling starting designated as the UC modeling start date on day 8”). (c) Disease activity index (DAI) score. (d) Colon length (cm). (e) The immune organ index of mouse spleen (mg/g). (f) Representative images of the colon and spleen.
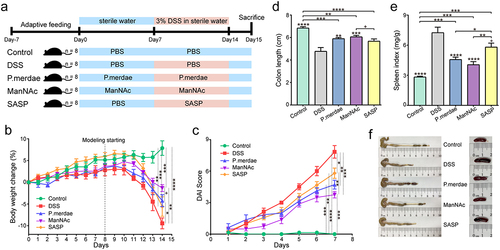
Figure 6. Effects of P.Merdae and ManNAc on cytokines and tight junctions (TJs). (a) The impact of P.Merdae and ManNAc on a panel of cytokines, encompassing IL-10, TNF-α, IL-1β, IFN-γ, IL-6, and IL-17, was assessed. (b) Expression of colonic tight junction, including ZO-1, occludin, and claudin-1.
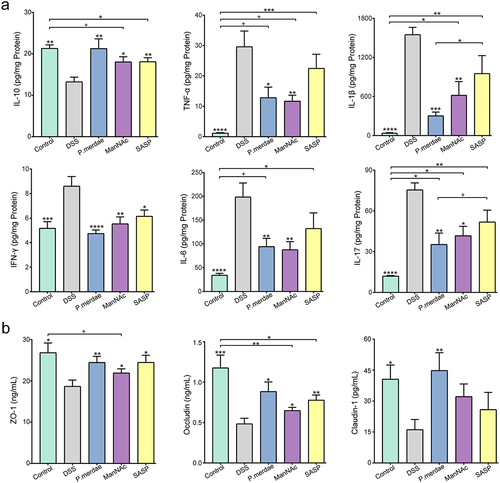
Figure 7. Effects of P. merdae and ManNAc on histological parameters. (a) Exemplary histological examination of the mouse colon, stained with H&E, at magnifications of × 5 and × 20. (b) Scoring of histopathological features in colon tissue. (c) Intestinal mucus layer thickness of colon tissue. (d) Exemplary mucus layer observation of the mouse colon, stained with AB-PAS, at magnifications of × 5 and × 20. (e) The number of mucus-goblet cells per villous-crypt of colon tissue. (f) The mean intensity of mucus of colon tissue.
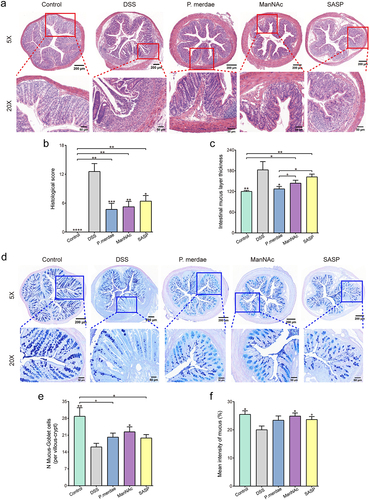
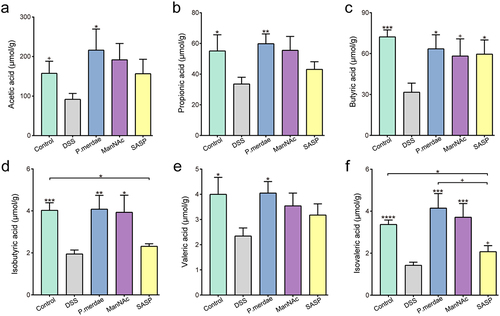
Figure 8. Levels of different SCFAs including (a) acetic acid, (b) propionic acid, (c) butyric acid, (d) isobutyric acid, (e) valeric acid, and (f) isovaleric acid in cecal contents.