
Figures & data
Figure 1. Phyla and genera comparison between wait-list and COBMINDEX at T1 demonstrates no significant differences.
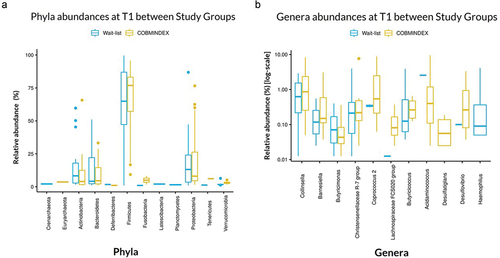
Table 1. Demographic characteristics at baseline of Crohn’s disease patients undergoing laboratory studies.
Figure 2. Correlations at T1 demonstrate significant ties between microbial abundance and psychological parameters.
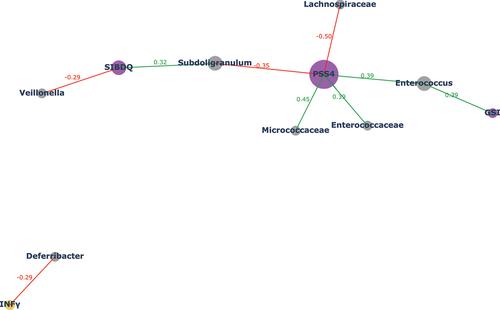
Figure 3. Significant changes in microbial abundance among COBMINDEX and wait-list CD patients.
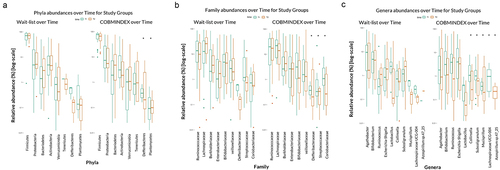
Figure 4. Alpha diversity did not differ in COBMINDEX and wait-list groups over time.
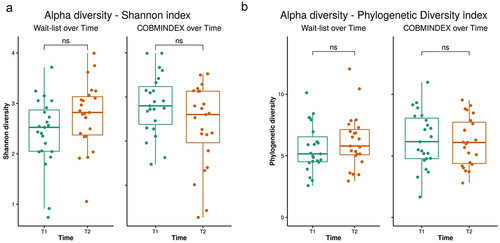
Figure 5. Beta diversity in COBMINDEX and wait-list CD patients over time.
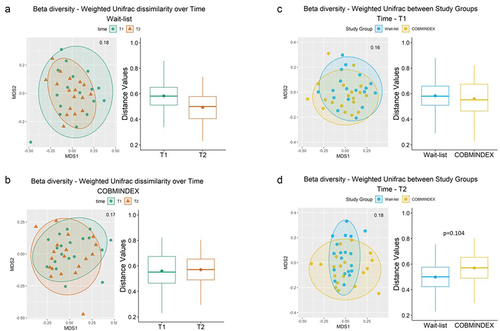
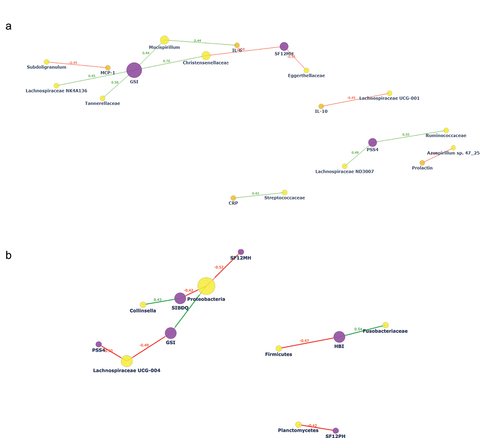
Figure 6. Differential correlations between microbial, psychological, and inflammatory markers in COBMINDEX vs wait-list CD patients.
Supplemental Material
Download JPEG Image (179.1 KB)
supp tables 140324 clean.docx
Download MS Word (33.5 KB)Data availability statement
The data supporting this study’s findings of this study are available on request from the corresponding author [A.M]. The data are not publicly available due to their containing information that could compromise the privacy of research participants.