
Figures & data
Figure 1. Study overview. A total of 50 pregnant women with obesity received either Vivomixx® probiotic or a placebo treatment from 14–20 weeks of gestation until birth. Administration of probiotics significantly increased the diversity of the GM compared to the placebo group as published elsewhere.Citation34 for the remainder of the study period, 47 infants were included with physical examination and health questionaries, besides having fecal samples collected 3 d, 3 months, 6 months, and 9 months after birth. This was done to evaluate whether the maternal prenatally supplemented probiotics influenced infant GM diversity and relative abundance. This figure was created with BioRender.com.
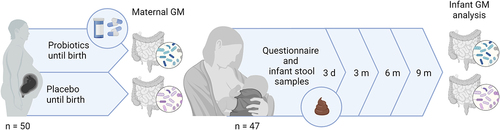
Table 1. Characteristics of the infants of mothers treated with probiotics or placebo during pregnancy included in the study.
Figure 2. Alpha diversity (Shannon Effective) over time after birth (3 days [3d] 3 months [3 m], 6 months [6 m], and 9 months [9 m]) for the two groups; mothers treated with placebo (red) or probiotics (blue). There was a significant increase (p < 0.05) in alpha diversity over time for both groups, but the two groups were not significantly different from each other at any of the specific time points (Wilcoxon rank sum tests).
![Figure 2. Alpha diversity (Shannon Effective) over time after birth (3 days [3d] 3 months [3 m], 6 months [6 m], and 9 months [9 m]) for the two groups; mothers treated with placebo (red) or probiotics (blue). There was a significant increase (p < 0.05) in alpha diversity over time for both groups, but the two groups were not significantly different from each other at any of the specific time points (Wilcoxon rank sum tests).](/cms/asset/798cebaa-9c47-4932-990f-a02499574dca/kgmi_a_2337968_f0002_oc.jpg)
Figure 3. Principal coordinate analysis (PCoA) on the Bray-Curtis dissimilarity of infants whose mothers were treated with probiotic or placebo group during pregnancy. Infants were followed with four visits (3 days [3d], 3 months [3 m], 6 months [6 m], and 9 months [9 m] after birth, respectively).
![Figure 3. Principal coordinate analysis (PCoA) on the Bray-Curtis dissimilarity of infants whose mothers were treated with probiotic or placebo group during pregnancy. Infants were followed with four visits (3 days [3d], 3 months [3 m], 6 months [6 m], and 9 months [9 m] after birth, respectively).](/cms/asset/4aed7c41-2cec-4415-a645-b3133651d643/kgmi_a_2337968_f0003_oc.jpg)
Figure 4. Relative abundance (%) of the genera Bifidobacterium, Lactobacillus, and Streptococcus respectively, for all time points (three days [3d], three months [3 m], six months [6 m], and nine months [9 m]) and for both; mothers treated with placebo (red) or probiotics (blue) during pregnancy. There were no significant differences between the groups at any of the specific time points.
![Figure 4. Relative abundance (%) of the genera Bifidobacterium, Lactobacillus, and Streptococcus respectively, for all time points (three days [3d], three months [3 m], six months [6 m], and nine months [9 m]) and for both; mothers treated with placebo (red) or probiotics (blue) during pregnancy. There were no significant differences between the groups at any of the specific time points.](/cms/asset/c94dbce7-37ab-45d4-aa5c-d554df5b3fdc/kgmi_a_2337968_f0004_oc.jpg)
Figure 5. Infant weight development over time in infants from mothers treated with probiotics or placebo. The charts display the number of infants with a body weight either under 2 SD of the median (dark blue), normal (blue) or 2 SD over the median (light blue) for the specific age group (3 days [3d], 3 months [3 m], 6 months [6 m] or 9 months [9 m] of age, respectively) according to WHO standards.
![Figure 5. Infant weight development over time in infants from mothers treated with probiotics or placebo. The charts display the number of infants with a body weight either under 2 SD of the median (dark blue), normal (blue) or 2 SD over the median (light blue) for the specific age group (3 days [3d], 3 months [3 m], 6 months [6 m] or 9 months [9 m] of age, respectively) according to WHO standards.](/cms/asset/d084505d-307e-43dc-b1d7-da733b4c4f0f/kgmi_a_2337968_f0005_oc.jpg)
Figure 6. Mean relative abundance at phylum level according to delivery mode. Three days after birth (3d), the relative abundance of Firmicutes had significantly increased in the infants delivered by cesarean section (“Sectio”) compared with those born by vaginal delivery (“Vaginal”) (p = 0.006), and Bacteroidetes was significantly increased in infants born by vaginal delivery when these were compared with infants delivered by cesarean section (p = 0.0005). No significant differences were observed for the remaining time points; 3 months (3 m), 6 months (6 m), or 9 months (9 m).
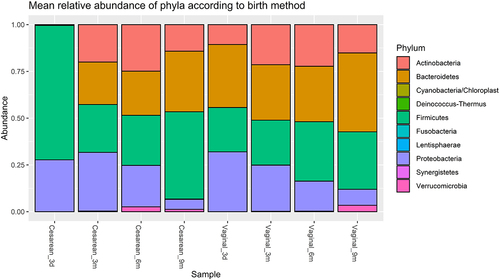
Figure 7. Relative abundance (%) of the genera Collinsella and Akkermansia over time (3 days [3d], 3 months [3 m], 6 months [6 m], and 9 months [9 m]) in infants from mothers treated with placebo (red) or probiotics (blue). No significant differences in differential abundance were observed between the treatment groups. However, the number of fecal samples in which the respective genera were detected, varied noticeably.
![Figure 7. Relative abundance (%) of the genera Collinsella and Akkermansia over time (3 days [3d], 3 months [3 m], 6 months [6 m], and 9 months [9 m]) in infants from mothers treated with placebo (red) or probiotics (blue). No significant differences in differential abundance were observed between the treatment groups. However, the number of fecal samples in which the respective genera were detected, varied noticeably.](/cms/asset/77d1910c-b54c-4cca-96bf-44f860c00898/kgmi_a_2337968_f0007_oc.jpg)
Supplemental Material
Download Zip (21.7 MB)Data availability statement
Due to the nature of this research, participants of this study did not agree for their data to be shared publicly, so supporting data is not available. The data are available from the corresponding author, AMP, upon reasonable request.