Figures & data
Table 1. Control and guar gum diet composition.
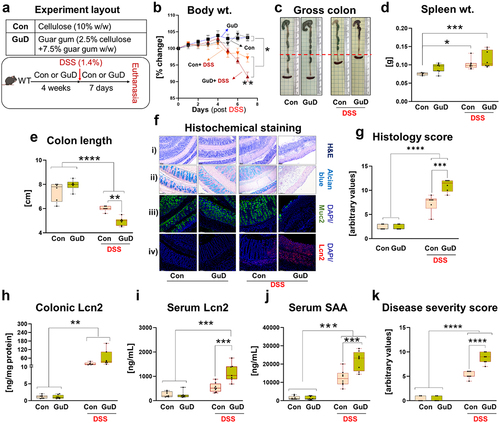
Table 2. Composite scoring system for assessing disease severity.
Table 3. Primer sequences.
Singh V, Kumar M, San Yeoh B, Xiao X, Saha P, Kennett MJ, Vijay-Kumar M. Inhibition of interleukin-10 signaling induces microbiota-dependent chronic colitis in apolipoprotein E deficient mice. Inflamm Bowel Dis. 2016;22(4):841–852. doi:10.1097/MIB.0000000000000699. Lei W, Ren W, Ohmoto M, Urban JF, Matsumoto I, Margolskee RF, Jiang P. Activation of intestinal tuft cell-expressed Sucnr1 triggers type 2 immunity in the mouse small intestine. Proc Natl Acad Sci USA. 2018;115(21):5552–5557. doi:10.1073/pnas.1720758115. Tsuru A, Fujimoto N, Takahashi S, Saito M, Nakamura D, Iwano M, Iwawaki T, Kadokura H, Ron D, Kohno K. Negative feedback by IRE1β optimizes mucin production in goblet cells. Proc Natl Acad Sci U S A. 2013;110(8):2864–2869. doi:10.1073/pnas.1212484110. Seregin SS, Golovchenko N, Schaf B, Chen J, Pudlo NA, Mitchell J, Baxter NT, Zhao L, Schloss PD, Martens EC. et al. NLRP6 protects Il10(-/-) mice from colitis by limiting colonization of Akkermansia muciniphila. Cell Rep. 2017;19(10):2174. doi:10.1016/j.celrep.2017.05.074. Zwanziger D, Rakov H, Engels K, Moeller LC, Führer D. Sex-dependent claudin-1 expression in the liver of euthyroid and hypothyroid mice. Eur Thyroid J. 2015;4(1):67–73. doi:10.1159/000431316. Zou J, Chassaing B, Singh V, Pellizzon M, Ricci M, Fythe MD, Kumar MV, Gewirtz AT. Fiber-mediated nourishment of gut microbiota protects against diet-induced obesity by restoring IL-22-mediated colonic health. Cell Host Microbe. 2018;23(1):41–53 e4. doi:10.1016/j.chom.2017.11.003. Su H, Xie L, Xu Y, Ke H, Bao T, Li Y, Chen W. Pelargonidin-3-O-glucoside derived from wild raspberry exerts antihyperglycemic effect by inducing autophagy and modulating gut microbiota. J Agric Food Chem. 2020;68(46):13025–13037. doi:10.1021/acs.jafc.9b03338. Holmes JL, Van Itallie CM, Rasmussen JE, Anderson JM. Claudin profiling in the mouse during postnatal intestinal development and along the gastrointestinal tract reveals complex expression patterns. Gene Expr Patterns. 2006;6(6):581–588. doi:10.1016/j.modgep.2005.12.001. Van den Bossche J, Laoui D, Morias Y, Movahedi K, Raes G, De Baetselier P, Van Ginderachter JA. Claudin-1, claudin-2 and claudin-11 genes differentially associate with distinct types of anti-inflammatory macrophages in vitro and with parasite- and tumour-elicited macrophages in vivo. Scand J Immunol. 2012;75(6):588–598. doi:10.1111/j.1365-3083.2012.02689.x. Fernandez-Martin JC, Espinosa-Oliva AM, Garcia-Dominguez I, Rosado-Sánchez I, Pacheco YM, Moyano R, Monterde JG, Venero JL, de Pablos RM. Gal3 plays a deleterious role in a mouse model of endotoxemia. Int J Mol Sci. 2022;23(3):23. doi:10.3390/ijms23031170. Tsuboi K, Nishitani M, Takakura A, Imai Y, Komatsu M, Kawashima H. Autophagy protects against colitis by the maintenance of normal gut microflora and secretion of mucus. J Biol Chem. 2015;290(33):20511–20526. doi:10.1074/jbc.M114.632257. Sakazaki Y, Hoshino T, Takei S, Sawada M, Oda H, Takenaka S-I, Imaoka H, Matsunaga K, Ota T, Abe Y. et al. Overexpression of chitinase 3-like 1/YKL-40 in lung-specific IL-18-transgenic mice, smokers and COPD. PLOS ONE. 2011;6(9):e24177. doi:10.1371/journal.pone.0024177.