Figures & data
Table 1. Summary of clinical data for 282 patients enrolled in this study.
Figure 1. Comparison of gut microbiomes between non-CRE and CRE groups.
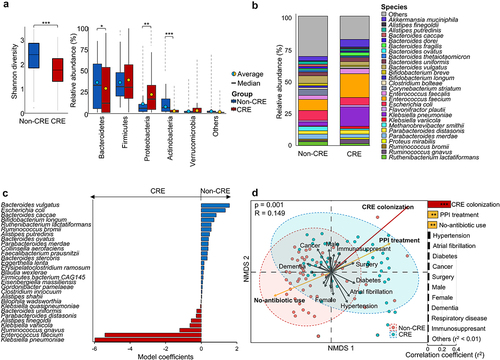
Figure 2. Alterations of the gut microbiome according to PPI treatment.
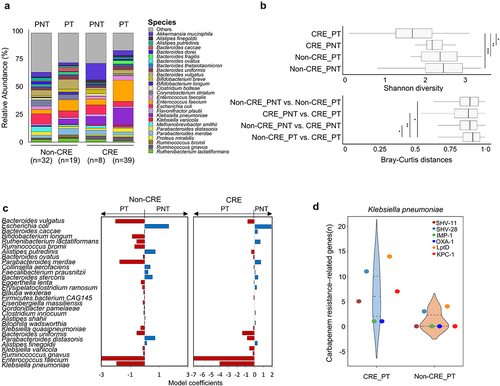
Table 2. Comparison of the odds ratio (OR) for the concomitant use of proton pump inhibitors (PPIs) and specific antibiotic classes associated with carbapenem-resistant Enterobacteriaceae (CRE) colonization in the gut microbiome analyzed 98 patients based on multivariable analysis.
Figure 3. Comparison of normalized counts of carbapenemase genes and carbapenem resistance-related efflux pump genes among groups.
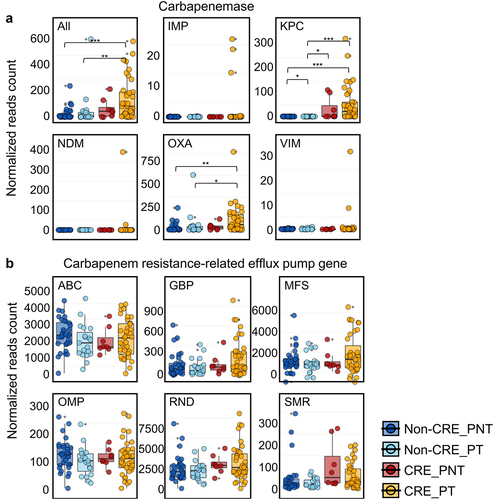
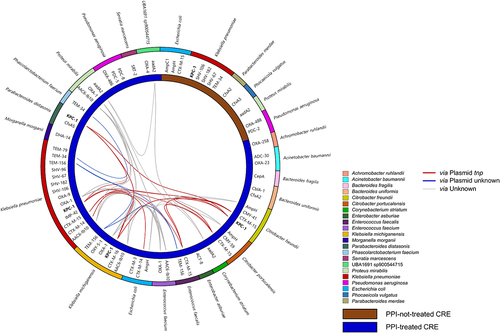
Figure 4. Predicted MGE transfer between bacterial species in CRE-PNT and CRE_PT groups compared using a circular phylogenetic tree based on MAGs.
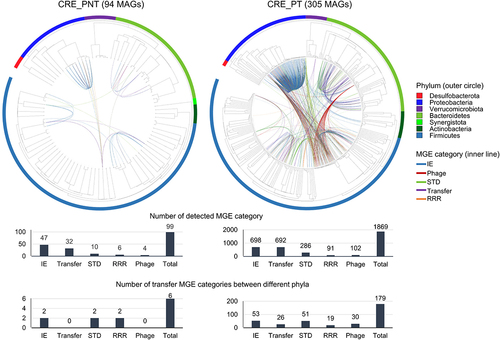
Figure 5. Transfer of carbapenem resistance genes (CRGs) between species in the gut microbiome of CRE carriers according to PPI treatment.