
Figures & data
Figure 1. Identification of genetic variations and candidate genes associated with colorectal tumor susceptibility in CC mice.
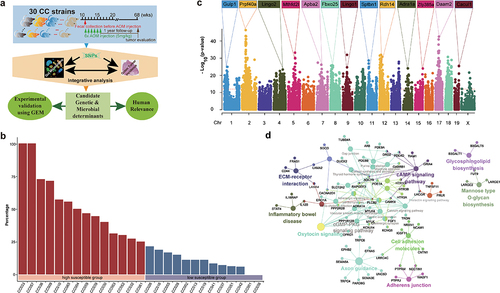
Figure 2. Subtyping human CRCs based on 334 CTS candidate genes.
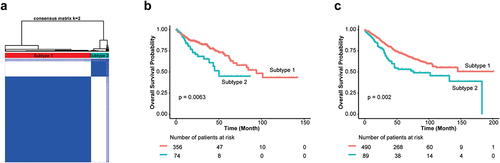
Figure 3. Differences in gut microbiome between high and low CTS group.
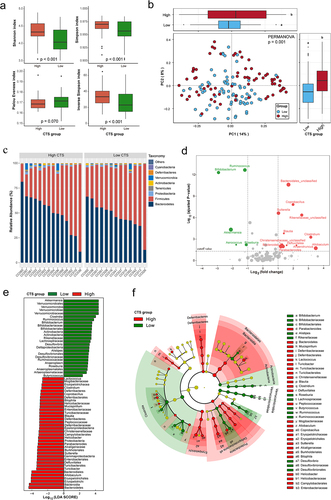
Figure 4. The core genera for predicting CTS and their related function analysis.
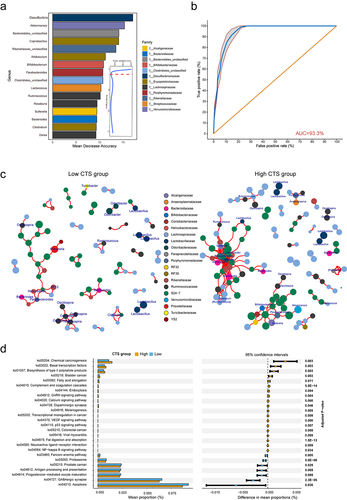
Figure 5. Gut microbiome partially mediates the effects of genetics on CTS.
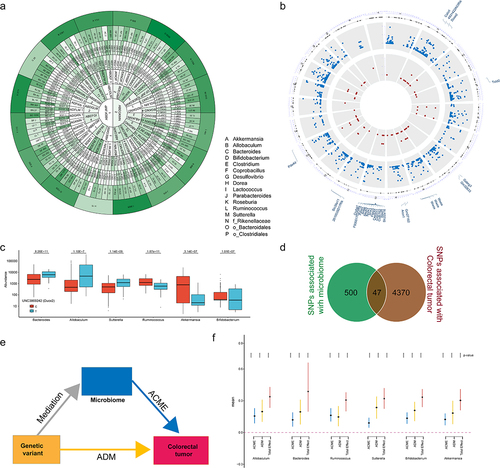
Figure 6. Depletion of Duox2 alters gut microbiome structure in mice.
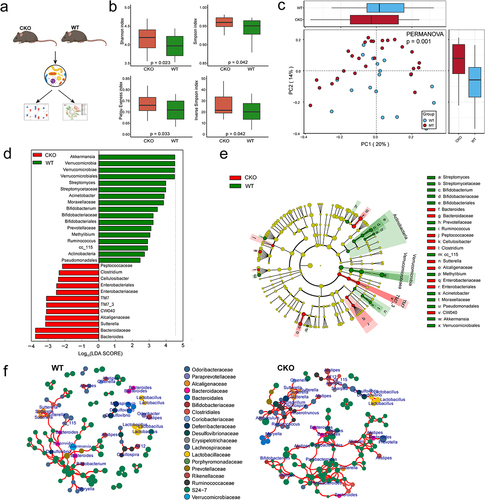
Figure 7. Interplay of Duox2 with gut microbiota and contributed to colorectal tumorigenesis susceptibility.
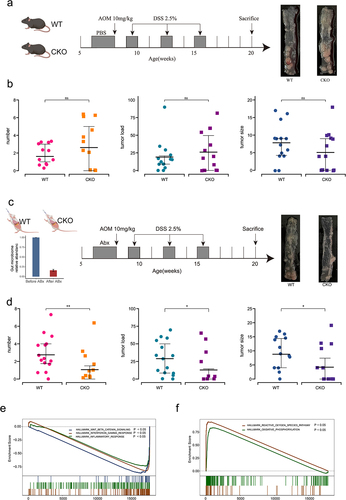
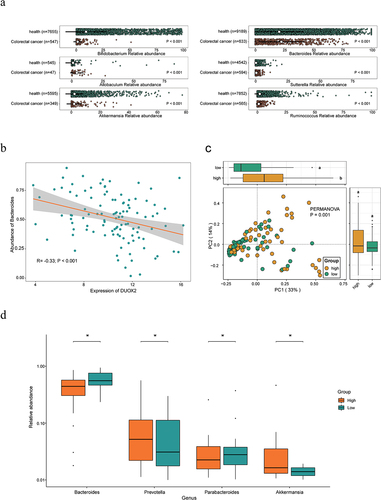
Figure 8. Validation of core different abundant taxa and the function of DUOX2 according to public data.
AOM_ColonTumor_GM_SupplementaryFigsTables.docx
Download MS Word (895.4 KB)Data availability statement
Mouse gut microbiome 16S rRNA gene sequencing data and RNA-Seq data from Doux2 knockout mice are are available in the National Center for Biotechnology Information (NCBI) BioProject Repository (https://www.ncbi.nlm.nih.gov/bioproject) under the BioProject “PRJNA802804”. Mouse gut microbiome 16S rRNA gene sequencing data from CC mouse cohort is available on OSF (https://osf.io/jbt5g/).Citation30 The mouse data has been included in Supplemental Table S1. The numeric counts table at genus level and corresponding taxonomic classifications have all been included as Supplemental Table S5.