
Figures & data
Table 1. List of bacterial strains used and their growth conditions. MRSA – methicillin-resistant Staphylococcus aureus, VISA – vancomycin intermediate Staphylococcus aureus.
Table 2. Activity of fidaxomicin (F), thuricin CD (T), vancomycin (V), and nisin (N) at a concentration of 10 μg/mL against a variety of bacterial strains measured by WDA. The zone size measured in mm was used to determine the color depicted in the Table. Values are means (n = 3). APC – APC culture collection, ATCC – American Type Culture Collection, DSMZ- German Collection of Microorganisms and Cell Cultures, DPC – Teagasc Culture Collection, LMG = Laboratorium voor Microbiologie, Universteit Gent, Belgium, JCM – Japan Collection of Microorganisms.
Table 3. MIC of fidaxomicin, thuricin CD, vancomycin, and nisin against a variety of bacterial strains. Values are means (n = 3).
Figure 1. Quantification of C. difficile cells prior to fermentation and 24 h after incubation for each antimicrobial and the no treatment control. Values are means ± standard error of the mean (SEM) (n = 9). ***, p ≤ 0.001; **, p ≤ 0.01; *, p ≤ 0.05.
Figure 2. (a) Antimicrobial activity of the fermentate of each sample against C. difficile APC 43 after 24 h of fermentation. (b) Antimicrobial activity of fermentate of nisin, thuricin CD, T0 control and T24 control after 24 h of fermentation and treatment with IPA-TFA.
Figure 3. Alpha Diversity presented as Shannon Indices after 24 h across treatment groups. T0 baseline control, No treatment control at 24 h, Fidaxomicin 100 µM at 24 h, Nisin 100 µM at 24 h, Thuricin CD 100 µM at 24 h and vancomycin 100 µM at 24 h.
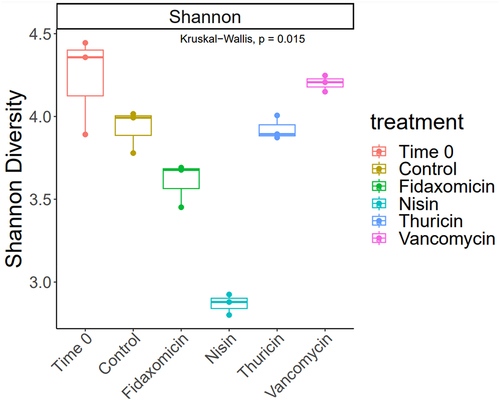
Figure 4. Beta Diversity presented as Bray-Curtis divergence after 24 h across treatment groups. T0 baseline control, No treatment control at 24 h, Fidaxomicin 100 µMat 24 h, Nisin 100 µM at 24 h, Thuricin CD 100 µM at 24 h and Vancomycin 100 µM at 24 h.
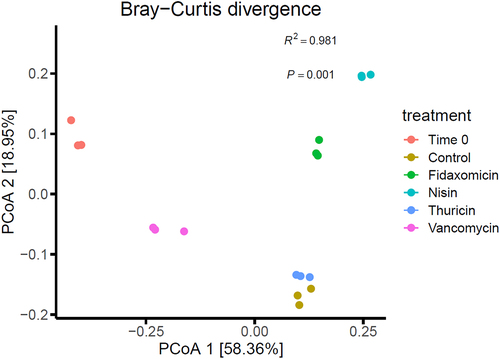
Figure 5. Relative abundance at the genus level across treatment groups.
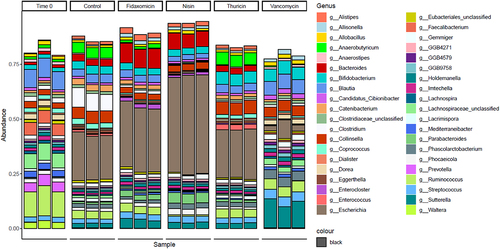
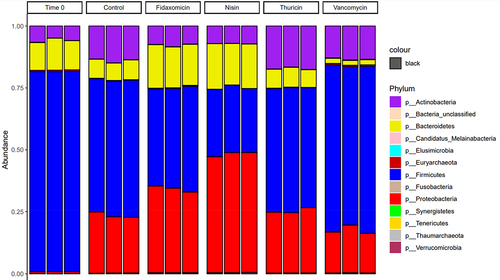
Figure 6. Relative abundance at the phylum level across treatment groups.
Data availability statement
The authors declare that all the data supporting our findings in the study are available within the paper.