
Figures & data
Figure 1. Macrophages were required in the activation of ILC2 induced by H. pylori infection. (a) ILC2 sorted out from PBMC were cocultured with H. pylori or together with GES-1. The IL-2 +IL-25 +IL-33 stimulating group was used as positive control. Elisa showed the level of Th2 cytokines (IL-4, IL-5, and IL-13) in the supernatants; (b) PBMC removing or remaining macrophages were cocultured with GES-1 and H. pylori ATCC43504 for 24 hours. The Th2 cytokines in the supernatants were detected by Elisa. p values were determined by one-way ANOVA, Dunnett-adjusted; error bars, SD (n = 3 per group); *p < .05, **p < .01, ***p < .001.
Figure 2. H. pylori infection promotes M2 polarization in peritoneal macrophages. H. pylori-infected mice were sacrificed at the 12th week or 24th week. (a) Flow cytometry was used to detect the peritoneal macrophages, and the extraction efficiency of mice peritoneal macrophages was more than 80%. (b, d) the expression of CD206 in mice peritoneal macrophages. (c, e) the ratio of M2/M1 macrophages. N: mice group with no treatment, NC: mice group treated with PBS, E: mice group treated with H. pylori strain of East Asian type, W: mice group treated with H. pylori strain of Western type SS1, C: mice group treated with CagA- H. pylori. p values were determined by one-way ANOVA, dunnett-adjusted; error bars, SD (n = 6 per group); *p < .05.
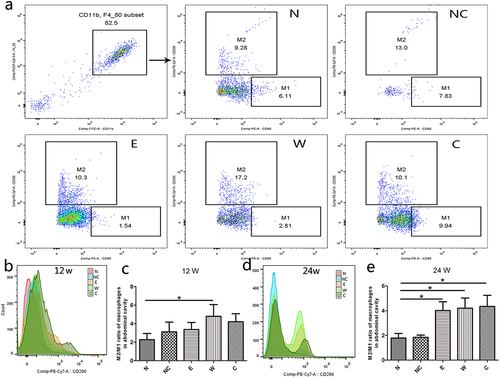
Figure 3. H. pylori infection promotes M2 polarization of macrophages in PBMC. In the H. pylori or the lysate of H. pylori coculture system: (a)The percentages of M1 and M2 macrophages were analyzed with flow cytometry. (b) The expression of CD206 in PBMC. NC: negative control. p values were determined by one-way ANOVA, Dunnett-adjusted; error bars, SD (n = 3 per group); *p < .05.
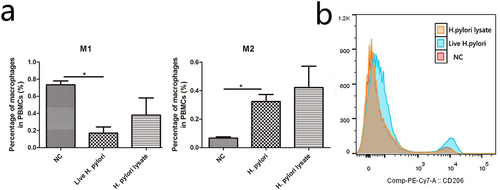
Figure 4. H. pylori infection promotes the expression of IDO and TSLP in macrophages. M0 macrophages were infected with H. pylori ATCC43504. (a) The concentration of TSLP in the supernatants. (b, c) the mRNA expression of TSLP and IDO. (d) The expression of IDO protein at different MOI. (e) The expression of IDO protein at different time points (MOI = 50). MOI: multiplicity of infection. p values were determined by one-way ANOVA, Dunnett-adjusted; error bars, SD (n = 3 per group); **p < .01, ***p < .001.
Figure 5. The expression of IDO is vital for macrophage M2 polarization in H. pylori infection. M0 macrophages were transfected with IDO siRnas and cocultured with H. pylori ATCC43504 for 24 hours. (a-c) flow cytometry was used to analyze the proportion of M2 macrophages (a, b) and the ratio of M2/M1 macrophages (c). (d) The concentration of TSLP in the supernatants. NC: negative control. p values were determined by one-way ANOVA, Dunnett-adjusted; error bars, SD (n = 3 per group); **p < .01, ***p < .001.
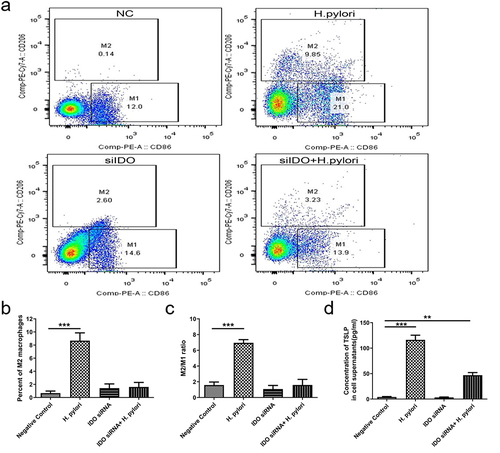
Figure 6. The influence of IDO on the expression of M1/M2 markers. (a, b) the mRNA expression of M1/M2 markers in M0 macrophages (a) and mice peritoneal macrophages (b). (c, d) the protein expression of M1/M2 markers in M0 macrophages (c) and mice peritoneal macrophages (d). p values were determined by one-way ANOVA followed by Dunnett correction (a) or Student’s t-test (c); error bars, SD (n = 3 per group); *p < .05, **p < .01, ***p < .001.
Figure 7. TSLP secreted by M2 macrophages increases the proportion of ILC2 in PBMC. (a) Three groups were cocultured with H. pylori: negative control group (NC), M2 macrophage group (M2), and anti-TSLP group (M2+anti-TSLP). (b) The proportion of ILC2 in PBMC. (c) The count of GATA-3+ cells in PBMC. (d) The proportion of GATA-3+ cells in PBMC. NC: negative control. p values were determined by one-way ANOVA, Dunnett-adjusted; error bars, SD (n = 3 per group); ***p < .001.
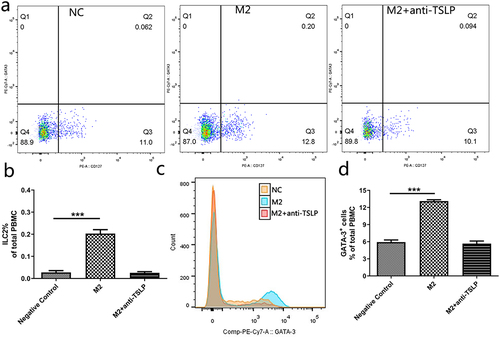
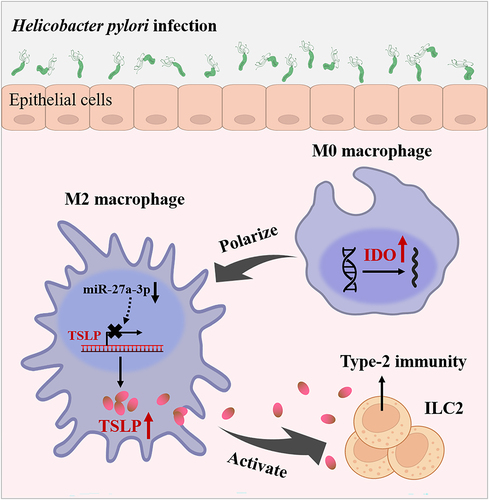
Figure 8. A schematic chart of H. pylori infection-induced ILC2 activation mechanism.
Supplemental Material
Download Zip (4.2 MB)Data availability statement
The authors confirm that the data supporting the findings of this study are available within the article and its supplementary materials.