
Figures & data
Figure 1. The enrichment of Christensenlla with modified PYG media (a, b) and the Christensenllaceae strain resources (c). For panel b, letter “F” represents fecal samples and the blue bars represent copy numbers of 16S rRNA genes before enrichment, letter “E” represents after enrichment. For panel c, the strains represent novel taxa are shown in red.
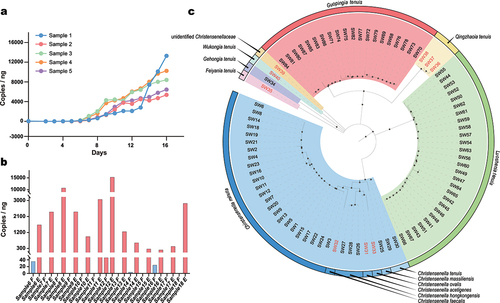
Table 1. Description and etymology of novel taxa (more detailed properties of the new taxa are available in supplementary data 2).
Figure 2. Phylogenomic tree and general genome features (a), pan- and core-genome analysis (b–d) of Christensenella strains. For panel a, the GTDB tree was constructed based on a concatenated alignment of 120 ubiquitous single-copy proteins. The genomes from NCBI were tagged by their genome accession numbers. Panel b shows the COG distribution of pan-, core- and unique genome of genus Christensenella. Panels c and d show the distribution of COGs at species (c) and at strain levels (d). Panel c shows the average numbers of the proteins detected in each category, and those categories of C, E, G, H, I, P, and Q are showed in red text. For panel d, the violin plot of protein categories related to metabolic proteins in different strains, including C, E, G, H, I, P, and Q. The three lines on the violin plot represent the upper quartile, median, and lower quartile.
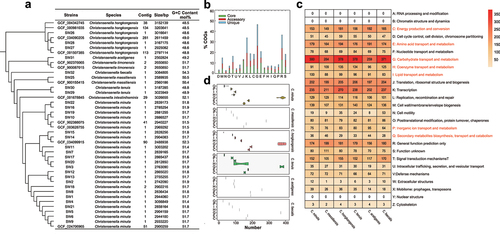
Figure 3. Genome annotation for glycosidases (a), biolog test results for carbon sources assimilation (b), and evaluation of acidity and bile acid tolerance and antibiotic resistance (c) of Christensenella strains. For a, the color change from blue to red and the sizes of circles represent the quantity of GHs. Absence of a circle indicates that the strain did not possess the corresponding GH. For b, the color orange represents the ability to utilize this carbon source, while light yellow represents the inability to utilize it. For panel c, the left part shows the survival rate of Christensenella strains after a 4-hour treatment at different pH values (2.0, 2.5, 3.0, 3.5). The color gray represents that the survival rate is 0. The number of bacterial colonies growing on agar plates at pH = 7 served as control. The middle part shows the effect of 0.3% bile acid on bacterial growth. Using bile -free medium as control, the time required to reach OD600 = 0.3 was determined (maximum 120 h). The time shown in the graph represents the lag period of strain growth, which is the time difference for strains to reach OD600 = 0.3 in the test and control media. The right part shows the bacterial resistance to 20 antibiotics at species and strain levels, with the number of strains in parentheses.
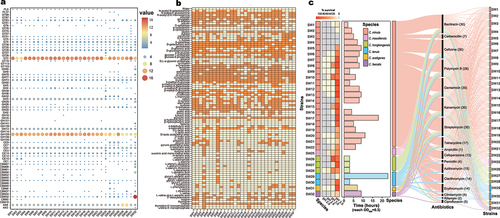
Figure 4. Metabolic profiling of Christensenella strains. a, volatile metabolite heatmap. The blue region (top) represents the production of short-chain fatty acids (SCFAs, μg/mL). All strains do not produce propionic, isobutyric, valeric and isovaleric acids. The yellow region (bottom) represents the metabolites detected through SPME-GC/MS and the color describes the relative amounts of metabolites represented with the peak area. According to the classification of metabolites, groups with less than 5 uniformly classified as others. b, the total number of metabolites of different Christensenella species. The species with only one strain is denoted by a horizontal line. center line: median. c, the number of different types of metabolites from different Christensenella species. The three lines in the violin plot represent the upper quartile, median, and lower quartile, respectively. The species with only one strain is denoted by a vertical line.
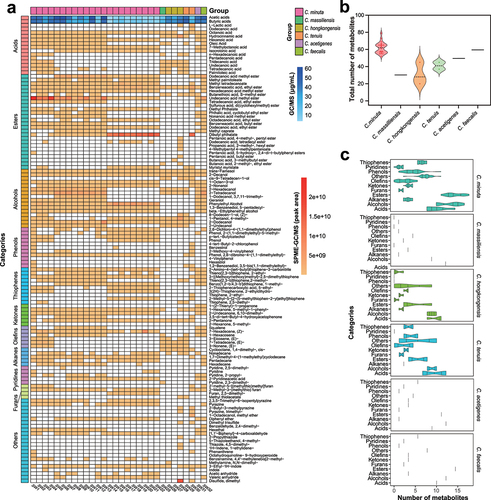
Figure 5. Bile acid modification with Christensenella strains. (a) detected bile acid modifications associated with Christensenella strains in this study. (b) quantitively detection of bile acid modifications to cholic acid (CA), chenodeoxycholic acid (CDCA), and taurocholic acid (TCA) with Christensenella strains. (c) comparison of bile salt hydrolase (BSH) gene information among different strains of Christensenella minuta. The purple color represents strains that were unable to hydrolyze bile acids, while the red color represented strains capable of bile acid hydrolysis. From inner to outer circles, the represented strains were as follows: 1) red portion: SW30, SW10, SW7, SW18, SW20, SW14, SW19, SW16, SW17, SW22, SW11, SW8, SW13, SW2, SW3. 2) purple portion: SW1, SW9, SW5, SW6, SW21, SW4, SW12. d, the variable genetic regions harboring BSH gene cluster. Strain SW15 was used as the reference genome.
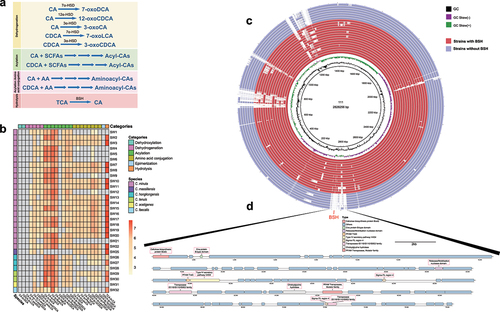
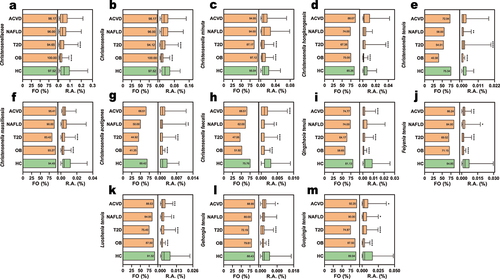
Figure 6. Distributions of christensenellaceae in health and disease cohorts. The frequency of occurrence (FO, left bar chart of each panel) and relative abundances (RA, right bar chart of each panel) of at family, genus and species levels. The box plot displays the average relative abundance (%), center line: median, bounds of box: quartile, bar: 5–95%ile. Abbreviations: atherosclerotic cardiovascular disease (ACVD, n = 218), obesity (OB, n = 104), nonalcoholic fatty liver disease (NAFLD, n = 50), type 2 diabetes mellitus (T2D, n = 187), and healthy cohorts (HC, n = 726). A non-parametric Kruskal–Wallis test followed by Dunn’s multiple comparisons test was conducted for statistical analysis. *p < .05; **p < .01; ***p < .001, ****p < .0001.
Supplemental Material
Download Zip (48.5 MB)Data availability statement
The datasets generated and analyzed in this study are available as the following: Basically, all the descriptive information and data related to 87 ChrisGMB strains were available at the hGMB homepage (https://hgmb.nmdc.cn/subject/christensenellaceae). The16S rRNA gene sequences of the 87 strains were deposited in China National Microbiology Data Center (NMDC) and the accession numbers were listed in supplementary Table S5. All assembled genomes obtained in this study were available at NMDC under Project NMDC10018522 (https://nmdc.cn/resource/genomics/project/detail/).