Figures & data
Figure 1. Gut microbiota characteristics of breast cancer patients. (a) Alpha diversity metrics. (b) Beta diversity showed by PCoA, and the statistic difference was analyzed by PERMANOVA and ANOSIM. (c) Enriched genera analysis by LEfSe. (d~i) relative abundance of Bifidobacterium, Collinsella, Faecalibacterium, Ruminococcus, Selenomonas and Succinispira genera. (j, k) relative abundance and prevalence of prevotella genus in all participants. (l, m) relative abundance and prevalence of prevotella genus in participants lower than 65 years old. (n, o) relative abundance of P. copri in all participants and that in participants lower than 65 years old. Numbers on top of each column indicated the ratio of prevotella-detectable or P. copri-detectable participants to the total participants. CA: breast cancer patients, n = 42; NC: control participant, n = 40. *, represents p < .05; **, represents p < .01.
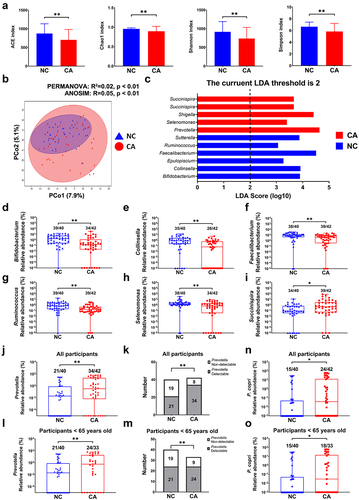
Figure 2. P. copri promotes 4T1 tumor growth in SPF and GF mice. (a~d) tumor pictures, tumor volumes change, tumor weight, body weight change. (e~h) tumor pictures, tumor volumes change, tumor weight, body weight change. SPF-Ctrl: control group under SPF; SPF-P: P. copri-treated group under SPF; GF-Ctrl: control group under GF; GF-P: P. copri-treated group under GF. n = 8. *, represents p < .05; **, represents p < .01.
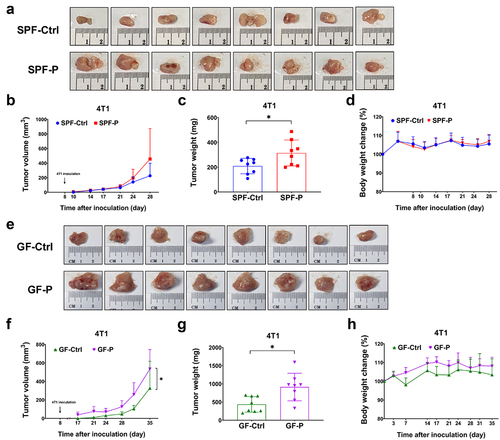
Figure 3. P. copri colonizes in the gut of SPF and GF mice. (a, b) relative abundance of P. copri in feces and contents in small intestine. n = 6. (c) Detection of P. copri in colon by FISH. (d) Detection of P. copri in tumor by FISH. *, represents p < .05; **, represents p < .01.
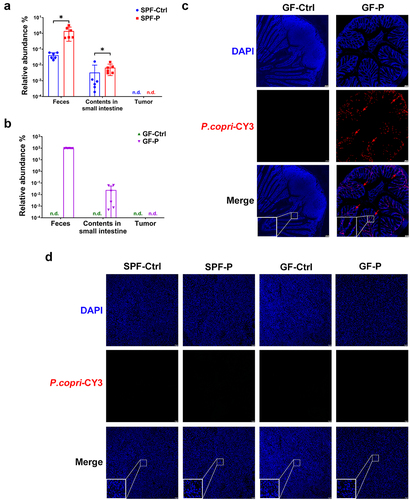
Figure 4. P. copri regulates protein profile of the 4T1 tumor. (a) Differential-expressed proteins (DEPs) showed by volcano plot. (b) Signaling pathway enrichment for DEPs based on KEGG. (c) DEPs involved in AMPK signaling pathway showed by heatmap. (d) Verification by WB for DNMT1, DNMT 3A, and UHRF1. SPF-Ctrl: control group under SPF; SPF-P: P. copri-treated group under SPF; GF-Ctrl: control group under GF; GF-P: P. copri-treated group under GF. For 4D-lable free protein omics, n = 3; for WB, n = 4. *, represents p < .05; **, represents p < .01.
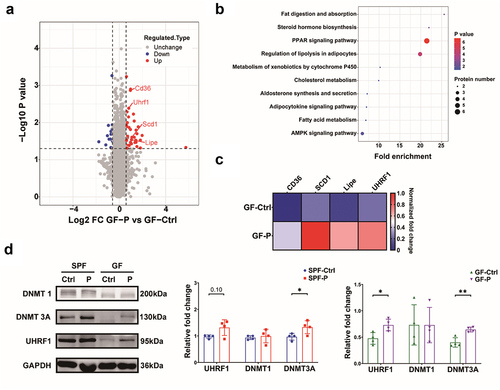
Figure 5. P. copri alters DNA methylation profile of the 4T1 tumor. (a) DNA methylation level in various genome function regions. (b) Numbers of the hypermethylated and hypomethylated DMRs. (c) Signaling pathway enrichment for genes with promoters that existed differential-methylated regions (DMRs) based on KEGG. (d) Genes with DMRs involved in AMPK signaling pathway showed by heatmap. (e) Verification by qPCR for the genes with differential methylated promoters. (f) Analysis for activity of AMPK, mTOR and ULK1. SPF-Ctrl: control group under SPF; SPF-P: P. copri-treated group under SPF; GF-Ctrl: control group under GF; GF-P: P. copri-treated group under GF. For RRBS, n = 3; for qPCR, n = 6 ~ 8; for WB, n = 4. *, represents p < .05; **, represents p < .01.
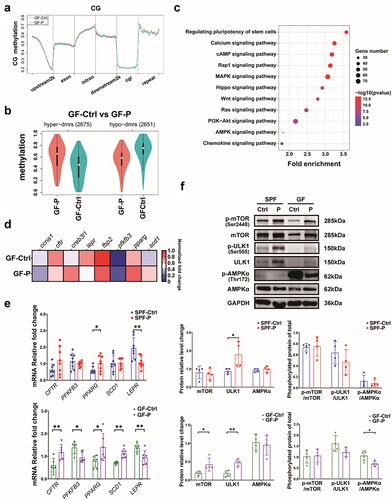
Figure 6. P. copri modulates host’s metabolites profile and exhausted the intrinsic anti-cancer IPyA. (A) Differential metabolites showed by heatmap in comparison between SPF-Ctrl and SPF-P, and that between GF-Ctrl and GF-P, n = 6. (B) Common differential metabolites showed by Venn diagram. (C) Contents of Indoleacetic acid (IAA), indolelactic acid (ILA), indole-3-propionic acid (IPA), and indole-3-pyruvic acid (IPyA), and tryptophan (Trp) in serum, n = 6. (D) Contents of Trp and IPyA in PYG medium after P. copri was cultured with Trp for 48 h, n = 3. (E) Tumor pictures, tumor volumes change, tumor weight, and body weight change in SPF mice treated by IPyA, n = 8. *, represents p < .05; **, represents p < .01.
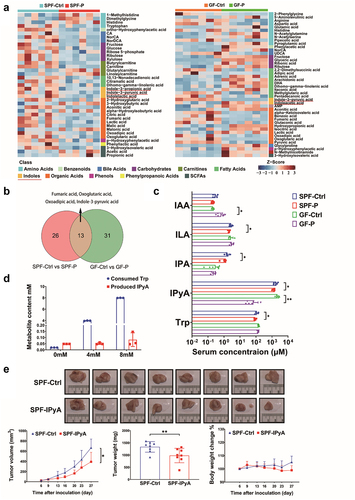
Figure 7. IPyA is cytotoxic to 4T1 cells. (A, B) cell viability of 4T1 cells treated by IPyA and Trp. (C) Colony formation of 4T1 cells treated by IPyA. (D) Expression of UHRF1, DMMT3A, and DNMT1 in 4T1 cells. (E) Total expression and phosphorylation of mTOR, ULK1, and AMPK in 4T1 cells. (F) mRNA level of CFTR, and PFKFB3, PPARG, SCD1, and LEPR by RT-qPCR. (G) Promoter methylation of CFTR by MS-qPCR. n = 3. *, represents p < .05; **, represents p < .01.
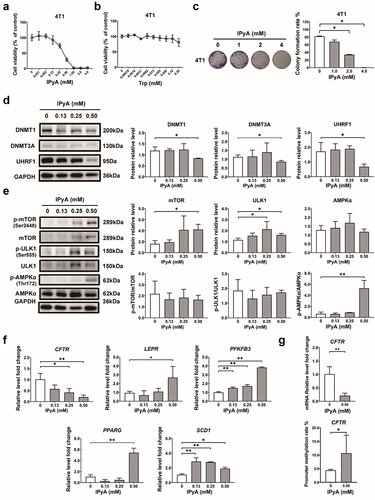
Figure 8. IPyA activates AMPK via suppressing the UHRF1-mediated negative regulation. (A) Expression of UHRF1, PP2A C, and AMPK phosphorylation in cytoplasm and nucleus, respectively. (B) The relative luciferase activity in 4T1 cells transfected with UHRF1 reporter plasmid. (C and D) kinetic curves for oxygen consumption rate (OCR) and extracellular acidification rate (ECAR). (E~G) ATP production analysis, including ATP produced from mitochondrial oxidative phosphorylation (mitoATP) and that from glycosis (glyATP). n = 3. *, represents p < .05; **, represents p < .01.
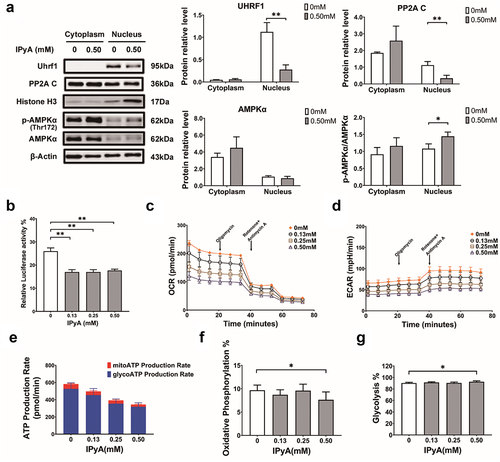
Figure 9. P. corpi promotes EMT6 tumor growth, while IPyA is cytotoxic to 4T1 cells. (A~D) tumor pictures, tumor volumes change, tumor weight, body weight change., n = 8. (E) Expression of UHRF1 and AMPK in tumor tissue by WB, n = 4. (F) Cell viability of EMT6 cells treated by IPyA, n = 3. (G) Colony formation of EMT6 cells treated by IPyA, n = 3. (H) Expression of UHRF1, total AMPK and phosphorylated AMPK in EMT6 cells, n = 3. *, represents p < . 05; **, represents p < . 01.
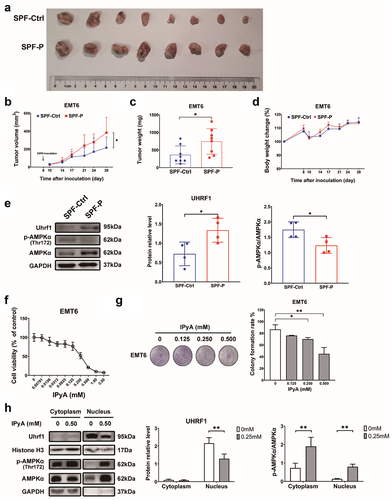
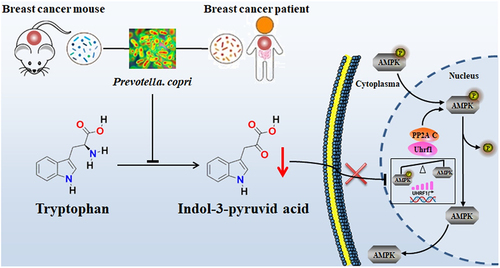
Figure 10. Working scheme. The excess P. copri consumes large amount of tryptophan (Trp), thus hampering the physiological accumulation of IPyA in host. IPyA is an intrinsic anti-cancer reagent in host at physiological level. Therefore, the deficiency of IPyA by P. copri inactivated the energy-controlling AMPK signaling pathway by the UHRF1-mediated negative control as indicated by the alternation in profiles of protein expression and DNA methylation.