
Figures & data
Figure 1. Disease-specific bacterial composition in the gut of murine model.
(a) The experiment diagram. Eight mice with colorectal cancer (ApcMin/+ mice) and 8 healthy mice were raised for 2 months. Then at month 2 (F1) and month 6 (F2), the feces of mice were collected. F1 and F2 represented the time points before and after the emergence of adenomas. (b) Examination of fecal occult blood test of mice. The feces of mice at month 2 (F1) and month 6 (F2) were subjected to the fecal occult blood test. The arrow indicated the positive signal. (c) Representative images of the adenomas in the colons of mice with colorectal cancer. The arrows indicated the adenomas. Scale bar, 1 cm. (d) Histological examination of mouse intestinal issues with hematoxylin and eosin staining. Scale bar, 100 μm. (e) Overview of microbial community structure in stool samples from healthy controls (F1 and F2) at phylum level. The community composition was indicated with bar plots, while names of specific samples were listed at the bottom. (F) Overview of microbial community structure in stool samples from two groups (healthy controls and CRC models; F1) at phylum level. The community composition was shown with bar plots. The specific samples were listed at the bottom. (g) Overview of microbial community structure in the fecal samples of CRC models (F1 and F2) at phylum level. The community composition was shown with bar plots. (h) Overview of microbial community structure in stool samples from two groups (healthy controls and CRC models; F2) at phylum level. The community composition was indicated with bar plots. (i) Principal component analysis (PCA) of the gut microbiota of healthy mice and ApcMin/+ mice at month 2 (F1 samples). (j) PCoA plots of the gut bacterial composition of healthy mice and ApcMin/+ mice at month 6 (F2 samples).
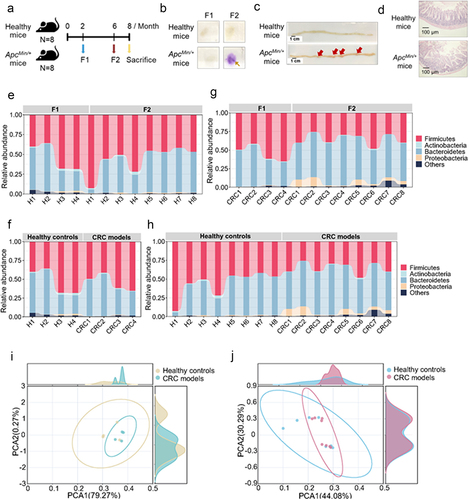
Figure 2. Potential bacterial markers of colorectal cancer.
(a) Genera whose abundances were distinct between healthy controls and CRC models (50 most important genera by GINI coefficient displayed-random forest). (b) Venn diagram of potential microbial signatures elevated in colorectal cancer of murine models (public datasets), human cohorts (public datasets) and our studies.
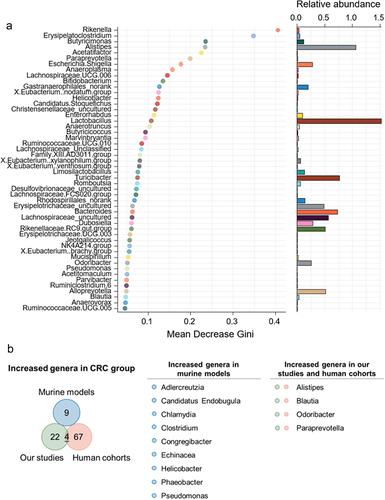
Figure 3. Relationship between gut bacteria-derived metabolites and colorectal cancer.
(a) The KEGG pathways of gut bacteria enriched in ApcMin/+ mice. (b) Correlations between the gut bacteria of mice with colorectal cancer and metabolic pathways. The correlation analysis was performed using Spearman’s correlation coefficient. Red indicated positive correlation, while black represented negative correlation. Significant correlation was shown with asterisks (*p<.05; **p<.01). (c) Volcano plot of the differentially enriched metabolites in healthy mice and ApcMin/+ mice. Based on metabolome analysis, the fold change with significant difference of metabolites between healthy mice and ApcMin/+ mice was evaluated (p<.01). (d) Heatmap of the relative abundance of metabolites significantly enriched in ApcMin/+ mice and healthy mice (log2 fold change > 1, p<.01). (e) The GC-MS analysis of the identified metabolites. The standards of agmatine and 5-aminopentanoic acid, agmatine and 5-aminopentanoic acid, which were randomly selected from the 95 metabolites, were analyzed with GC-MS. m/z, mass-to-charge ratio. (f) The relationship between the gut bacteria and the metabolites enriched in ApcMin/+ mice. In the Chord graph, the bacteria were indicated in red, while the metabolites were shown in blue.
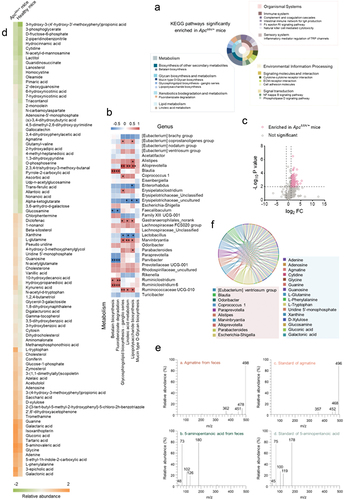
Figure 4. Promotion of inflammation by the gut metabolites to induce colorectal carcinogenesis.
(a) Agmatine concentration in the plasma of normal rats (n = 6) and CRC rats (n = 6) (*, p<.05; **, p<.01). The data were obtained from Ref Liu rt al (2017). (b) Content of agmatine in healthy donors (n = 4) and CRC patients (n = 4) (**, p<.01). (c) Activation of the Wnt signaling pathway in the intestinal tissues of agmatine-treated mice. The healthy mice were administrated with agmatine at different concentrations via coloclysis and raised for 24 h. Subsequently the large intestines were collected and subjected to Western blot analysis. β-tubulin was used as a control. (d) Immunohistochemistry analysis of large intestines of mice. The large intestines of the healthy mice treated with agmatine at different concentrations were subjected to immunohistochemistry analysis to detect β-catenin, cyclin D1, Ki-67 and p21 proteins in the epithelial cells of large intestines (brown). The nucleus was labeled with hematoxylin (blue). The representative images were shown. The concentration of agmatine was shown on the top. The data of quantitative analysis of cyclin D1, Ki-67, p21 and β-catenin staining in colon sections of mice treated with different concentrations of agmatine (0, 0.1 and 100 mM) were indicated on the bottom (*, p <.05). Scale bar, 50 μm. (e) Pathology of large intestines of mice. The agmatine-treated mice were subjected to hematoxylin-eosin (H&E) staining. The concentration of agmatine was indicated on the left. The arrows with different colors represented dysplasia. Scale bar, 100 μm. (f) Pathologic scores of the large intestinal tissues of agmatine-treated mice. Based on the staining with hematoxylin and eosin, the intestinal tissue sections of three-group mice (5 mice/group) were examined histologically using a scoring system. The data were presented as mean ± SD (standard deviation) (*, p<.05; **, p<.01). (g) Impact of agmatine on the expressions of cytokines. The healthy mice were treated with agmatine at different concentrations. Twenty-four hours later, the expression levels of IL-6, IL-10 and TNF-α in large intestines of mice were examined with Western blot. β-tubulin was used as a control. (h) Influence of agmatine on the proliferation of colorectal cancer cells. Colorectal cancer cells (HCT116) were treated with agmatine at different concentrations. At different time after treatment, the cell viability was determined using MTS [(3-(4, 5-dimethylthiazol-2-yl)-5-(3-carboxymethoxyphenyl)- 2-(4-sulfophenyl)-2 H tetrazolium) assay. Data presented were means ± standard deviations (SD) of three biological replicates. (i) Influence of the gut microbiota and the resultant metabolites on the intestinal inflammation of mice. The healthy mice were treated with the gavage of antibiotic cocktail for 1 week. Subsequently the mice were treated with the gavage of the bacteria from the stool of ApcMin/+ mice (CRC-FMT). As a control, the bacteria from the stool of C57BL/6J mice (Control-FMT) were included in the gavage. Two weeks later, the colons of mice were subjected to Western blot to examine IL-6, IL-10 and TNF-α. β-tubulin was used as a control.
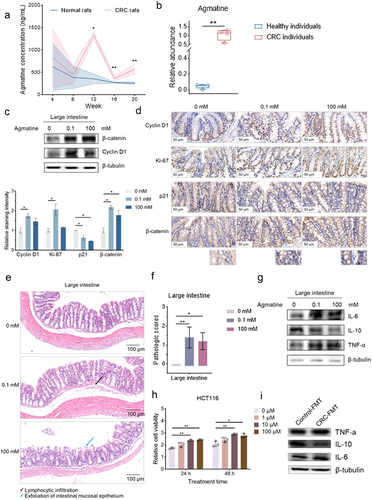
Figure 5. Underlying mechanism of agmatine-driven intestinal inflammation and adenomas in mice.
(a) The proteins bound to agmatine. The agmatine-coupled hydroxylsuccinimide (NHS)-activated beads were incubated with the proteins extracted from the mouse intestinal tissues. As a control, the beads alone (control) was included in this experiment. The proteins specifically bound to agmatine were analyzed by SDS-PAGE with Coomassie blue staining, followed by the protein identification using mass spectrometry. The arrows indicated the proteins bound to agmatine. M, protein marker. (b) Western blot analysis of the proteins bound to agmatine. The proteins extracted from the mouse intestinal tissues was incubated agmatine-coupled NHS-activated beads. The beads alone (control) was used as a control. The elutes were analyzed using Western blot with Rnf128 or Hspa5-specific antibody. (c) The direct interaction between agmatine and Rnf128. The binding of agmatine to Hspa5 (left) or Rnf128 (right) was characterized using ITC. The purified recombinant Hspa5 or Rnf128 protein was used in the ITC analysis. (d) The 3-dimensional map of the binding sites between agmatine and the Rnf128 protein. The 3-dimensional map was obtained using DOCK 6.9. Grid score (kcal/mol) was -289.790161. Grid vdw (kcal/mol) was 1.094912 and grid es (kcal/mol) was -290.885071. The internal energy (kcal/mol) equaled 5.925114. The cluster size was 3. (e) Influence of agmatine on the expression of Rnf128 in large intestines of mice. The healthy mice were administrated with or without agmatine via coloclysis. Twenty-four hours later, the large intestinal samples from agmatine-treated mice (agmatine) or untreated mice (control) were subjected to Western blot analysis. β-tubulin served as a control. (f) Influence of agmatine on the stability of β-catenin protein. The healthy mice received coloclysis of agmatine and/or intraperitoneal injection of MG132. Twenty-four hours later, the large intestines were subjected to Western blot analysis. β-tubulin was used as a control. (g) Influence of agmatine on the stability of β-catenin protein. The healthy mice were treated with CHX by intraperitoneal injection, followed by coloclysis of saline or agmatine. At different time after the treatment, the large intestines of the mice treated with CHX and agmatine or CHX alone (control) were subjected to Western blot analysis. β-tubulin served as a control.
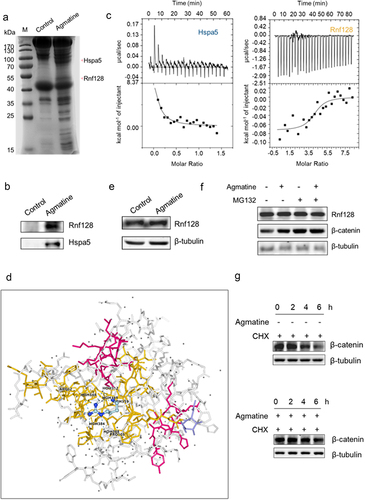
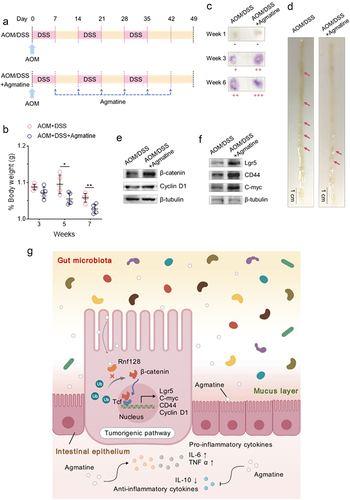
Figure 6. Promotive effects of agmatine on carcinogen-induced intestinal tumorigenesis of mice.
(a) Experimental flow chart of azoxymethane (AOM)/dextran sodium sulfate (DSS)-induced colorectal cancer model. The mice were randomly divided into 2 groups, including 5 mice treated with AOM/DSS and 5 mice treated with AOM/DSS and agmatine. All the mice were intraperitoneally injected with AOM at Day 0. The drinking water containing 2.5% DSS was administered to mice 0 for 7 days. For agmatine, the mice were treated with agmatine via coloclysis once a week for 6 weeks. Mice were euthanized on Day 49. (b) Determination of mouse body weight. The body weight of the mice treated with AOM/DSS alone or AOM/DSS and agmatine was examined every two weeks. The significance between treatments was indicated with asterisks (*, p<.05; **, p<.01). (c) Examination of fecal occult blood test of mice. The fecal samples of mice treated with AOM/DSS or AOM/DSS and agmatine at Week 1, 3 and 6 were subjected to the fecal occult blood test. The strength of positive signal was reflected by plus sign (+). (d) Representative images of the intestinal adenomas in the mice treated with AOM/DSS or AOM/DSS and agmatine. The arrows indicated the intestinal adenomas. Scale bar, 1 cm. (e) Western blot analysis of β-catenin and cyclin D1 in the intestinal adenomas of mice treated with AOM/DSS or AOM/DSS and agmatine. β-tubulin served as a control. (f) Influence of agmatine on the stemness of the mouse intestinal adenomas. The intestinal adenomas of the mice treated with AOM/DSS or AOM/DSS and agmatine were subjected to Western blot analysis to examine Lgr5, CD44 and C-myc the markers of stem cells. β-tubulin was used as a control. (g) Model for the gut microbiota-driven colorectal carcinogenesis via the agmatine-mediated activation of Wnt signaling pathway.
Supplemental material