Figures & data
Figure 1. Sample integration and analysis process.
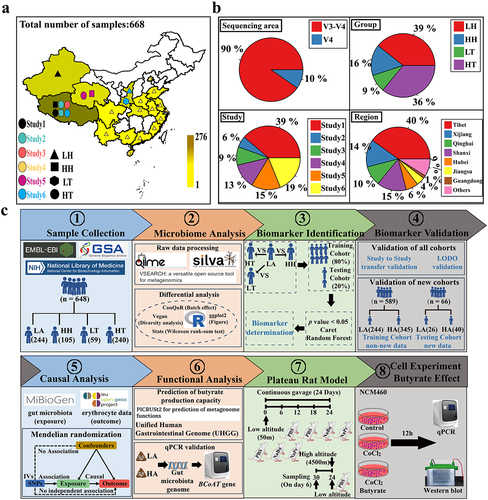
Figure 2. Differences in gut microbiota between high- and low-altitude people.
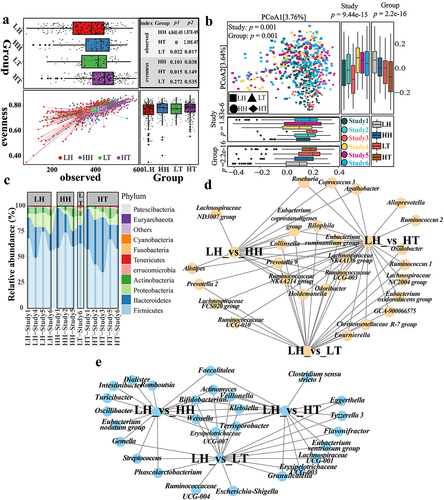
Figure 3. Identification of gut microbiota biomarkers in plateau population.
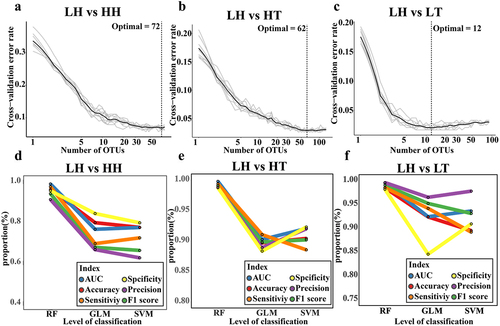
Figure 4. Validation of predictive performance of gut microbiota biomarkers in plateau population.
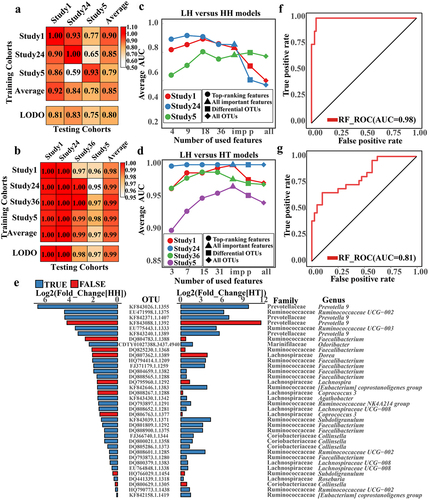
Figure 5. The causal relationship between gut microbiome and altitude adaptation.
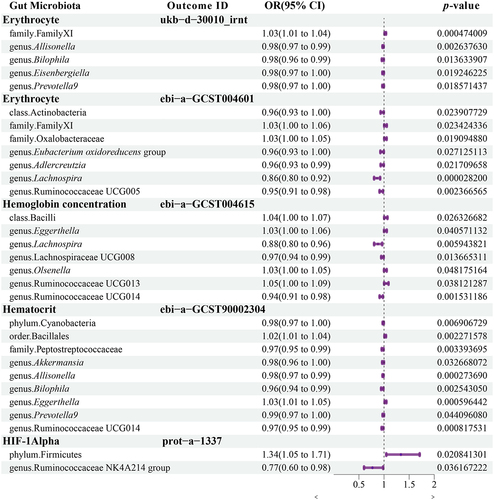
Figure 6. Changes in the abundance of gut microbiome SCFA-producing bacteria in high- and low-altitude population.
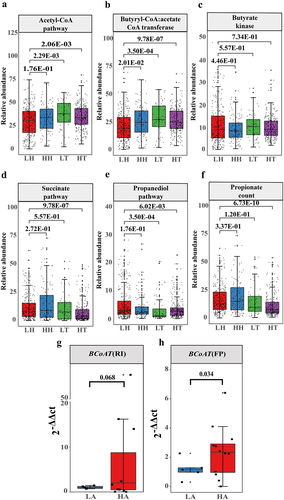
Figure 7. SCFA relieved intestinal damage caused by the plateau environment.
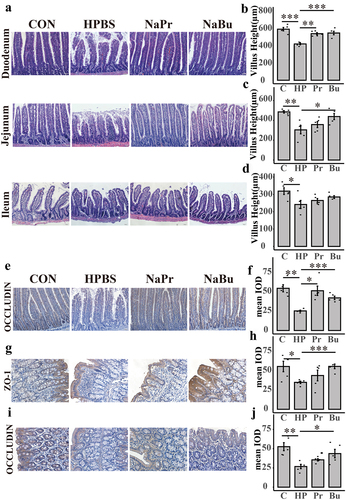
Figure 8. Butyrate alleviates intestinal damage caused by hypoxia by down-regulating HIF-1α in NCM460.
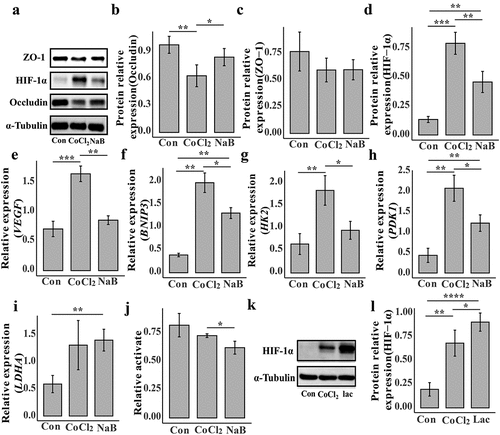
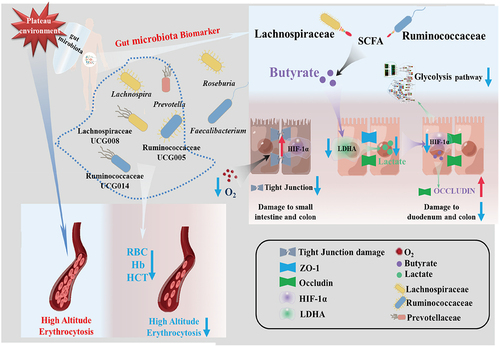
Figure 9. The potential mechanism of gut microbiota biomarkers to help maintain human health at the plateau.