
Figures & data
Table 1. Population characteristics.
Figure 1. Assessment of bacterial biomass in biopsies collected from patients with and without CRC. (a) Diagram showing the anatomical sampling of CRC biopsies. (b) Cross-sections of tumour biopsies and healthy tissue biopsies showing the distribution of bacterial biomass. Yellow arrows indicate the area with bacterial biomass. Dashed boxes and white arrows show the morphological evidence of bacteria in the cross-section of a tumour biopsy (image C). Tissue was visible via autofluorescence. Scale bars are shown in the lower-left corner of all images. (c) Logarithmic (log) transformed bacterial biomass measured in cubic micrometres (µm3) from collected biopsies. (d) Total tissue biomass (bacteria and tissue) measured in µm3 from collected biopsies. (e) Log-transformed bacterial biomass on the left- and right-sided tumour biopsies measured in µm3. statistical comparison was carried out with paired and unpaired t-tests (C), paired t-test and Mann-Whitney test (D), and unpaired t-test (E). Bars represent standard deviation (SD). A p-value ≤0.05 was considered statistically significant.
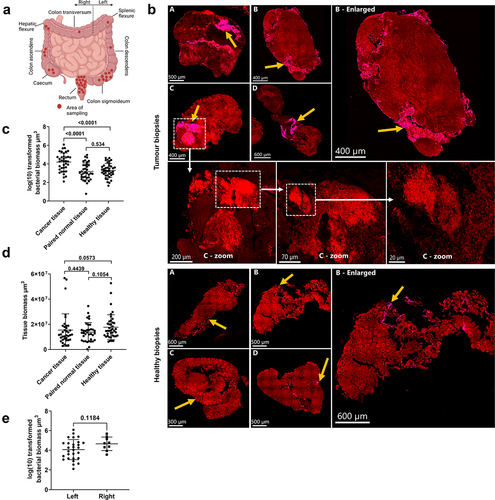
Figure 2. Prevalence of Fusobacterium spp. and B. fragilis in CRC, paired normal, and healthy tissue. (a) Representative images showing the qualitative separation of FUS714 (Fusobacterium spp.) from bfrag-998 (B. fragilis) in spiked tissue (top panel) and tumour tissue (bottom panel). (b) Prevalence of Fusobacterium spp. in healthy tissue and cancer tissue. (c,d) Prevalence of B. fragilis (C) and Fusobacterium spp. (d) in left- and right-sided tumours. (e) Representative images showing mixed-species biofilms with B. fragilis (red), Fusobacterium spp. (green), other bacteria (purple), and host cells (blue). Image A is an overview image, and the white dashed box shows the enlarged area in image B. (f,g) correlation between the prevalence of Fusobacterium spp. (B) and B. fragilis (C) and logarithmic (log) transformed bacterial biomass in CRC tissue measured in cubic micrometres (µm3). (h) Percentage of CRC samples positive with either Fusobacterium spp., B. fragilis, co-infected or negative. (I) The percentage of bacterial biomass for B. fragilis and Fusobacterium spp. on a subset of co-infected samples (n = 7) with high bacterial biomass. (J) Scaled counts assigned to the B. fragilis toxin (BFT) and F. nucleatum virulence factors FadA, Fap2, FomA, and RadD. Scale bars are shown in the lower-left corner of all images. Statistical comparison was carried out with Fisher’s exact tests (B+C+D), unpaired t-tests (F+G), and Mann-Whitney tests (I). Bars represent standard deviation (SD). A p-value ≤ .05 was considered statistically significant.
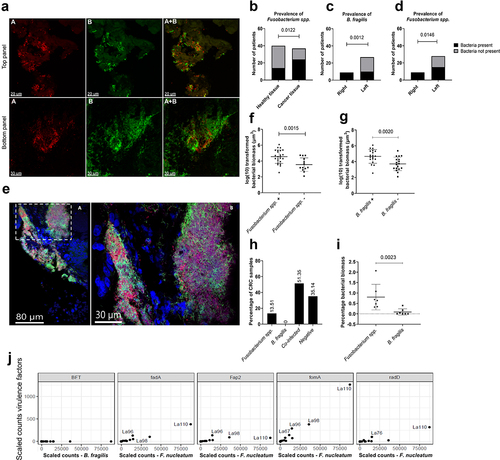
Figure 3. Histopathological evaluation of the bacterial influence on the TME. (a) Inflammation score for CRC samples with high and low bacterial biomass, divided into acute and chronic inflammation. (b,c) Inflammation score for CRC samples with (+) and without (-) B. fragilis (B) and Fusobacterium spp. (C), divided into acute and chronic inflammation. (d) Representative images showing the co-localisation of bacterial biomass and necrotic tissue on cross-sectioned tumour biopsies. The red encircled area indicates the area with necrosis, and the yellow arrows indicate the area with bacterial biomass. All biomass measurements were performed with the Imaris software through thresholding of fluorescence intensity. Tissue was visible via autofluorescence. Scale bars are shown in the lower-left corner of all images. Statistical comparison was carried out with Mann-Whitney tests (A+B+C). Bars represent standard deviation (SD). A p-value ≤ 0.05 was considered statistically significant.
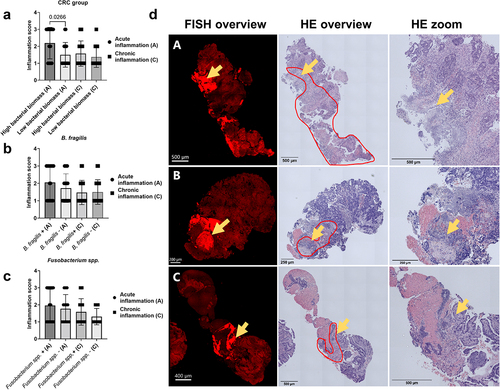
Figure 4. Characterisation of bacterial richness and diversity in CRC, paired normal, and healthy tissue. (a) Scaled counts assigned to bacteria in CRC, healthy, and paired normal tissue. (b) The alpha diversity in CRC, healthy, and paired normal tissue was compared with the Shannon index. (c) Scaled counts assigned to Fusobacteria in CRC, healthy, and paired normal tissue. (d) Relative abundance of scaled counts assigned to B. fragilis and F. nucleatum in CRC, paired normal, and healthy tissue. (e) Relative abundance of scaled counts assigned to Fusobacterium spp. in CRC tissue. Statistical comparison was carried out with Wilcoxon signed-rank test and Wilcoxon rank-sum-test (A+C+D), paired and unpaired t-tests (B), and Mann-Whitney tests (D). Bars represent standard deviation (SD). A p-value ≤ 0.05 was considered statistically significant.
Figure 5. Differentially expressed genes (DEGs) and tissue immune phenotype. (a) MA plot showing the distribution of significantly differentially expressed genes between CRC tissue with high and low bacterial activity. Colouring highlights the 20 most significant DEGs with an adjusted p-value less than 0.05 and absolute log2 fold-change >2. (b) The Kyoto Encyclopedia of genes and genomes (KEGG), pathway interaction database (PID), and REACTOME (a database of reactions, pathways, and biological processes) databases were used to identify pathways that were significantly enriched or decreased in CRC tissue with high and low bacterial activity. (c,d) Heatmaps showing immune cell profiles in CRC, healthy, and paired normal tissue, presented as fractions from the quantisec, epic, and estimate immune scoring systems (C) and normalized scores from the concensus_tme, xcell, mcp_counter, and timer immune scoring systems (D). Colouring from yellow (−4) to purple (4) indicates the degree of infiltration, where purple is high infiltration. (e) Four immune cell profile clusters (Clus1-Clus4) were defined in this study based on the hierarchical clustering of samples according to immune cell infiltration in the heatmaps. Y and N indicate whether samples were stable to the assigned clusters.
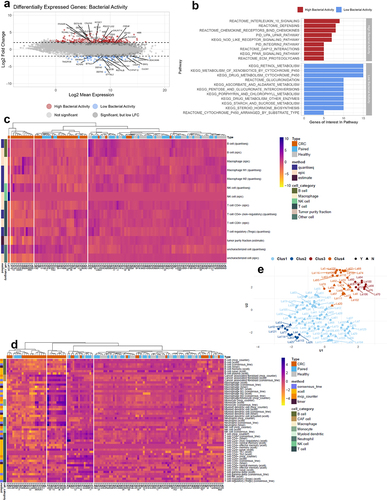
Table 2. Bacterial groups impacting infiltration of specific immune cells in CRC tissue.
Supplemental Material
Download Zip (34.3 MB)Data availability statement
The raw sequencing data and gene count tables produced in this study are not accessible to the public, as such an action would infringe upon patient consent and ethical regulations stipulated by the authorities in Denmark. Processed data devoid of sensitive information and original code supporting the results of this study is available in the Supplementary Information as well as in a Zenodo repository (DOI: https://zenodo.org/doi/10.5281/zenodo.10997467). Additional information is available upon reasonable request, and in the case of raw sequencing data, appropriate permissions are required for data accession.