
Figures & data
Figure 1. Increasing concentrations of ethanolamine (EA) do not confer a growth advantage to L. brevis.
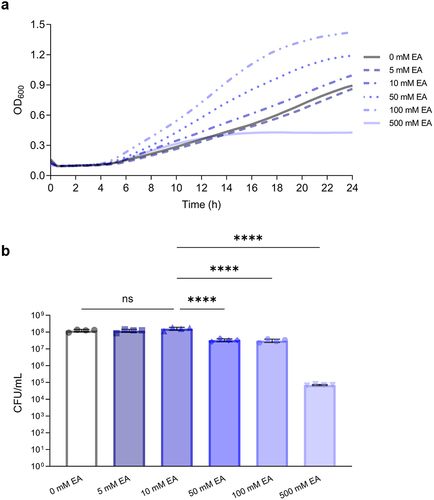
Figure 2. Ethanolamine (EA) clearance during growth.
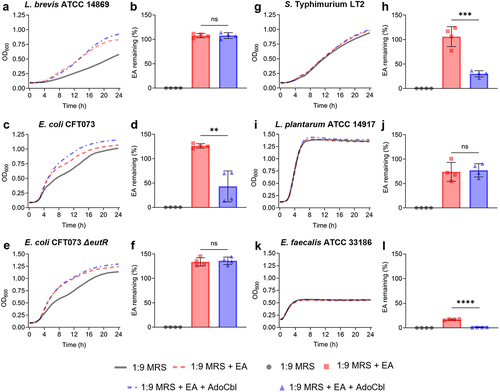
Figure 3. Utilization of ethanolamine as a nitrogen source reduces the growth of L. brevis ATCC 14869.
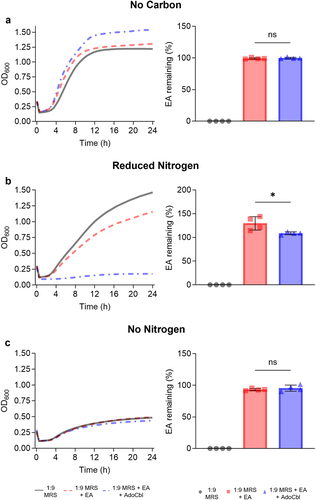
Figure 4. Transmission electron microscopy (TEM) of L. brevis ATCC 14869 reveals bacterial microcompartment formation.
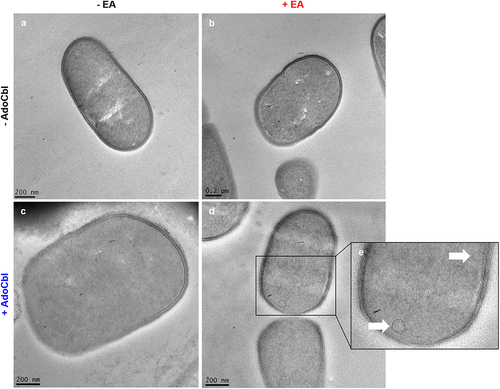
Figure 5. RNA sequencing analysis of L. brevis ATCC 14869 grown with ethanolamine (EA) and adenosylcobalamin (AdoCbl).
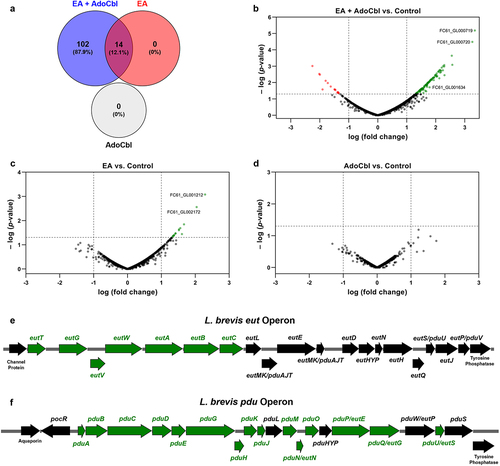
Figure 6. qPCR analysis of L. brevis ATCC 14869 eut, pdu, and apf genes.
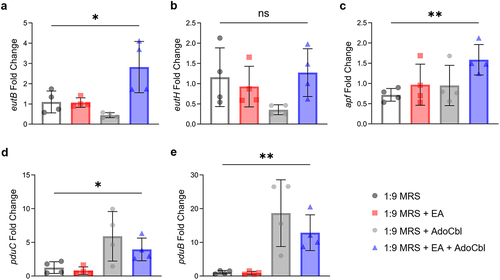
Table 1. Differentially expressed transcripts by L. brevis in the presence of ethanolamine and adenosylcobalamin.
Figure 7. The influence of ethanolamine (EA) on L. brevis ATCC 14869 adhesion to abiotic factors.
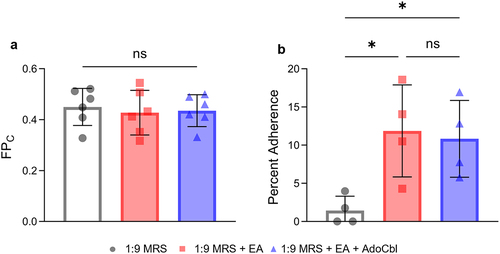
Figure 8. Ethanolamine (EA) influences L. brevis ATCC 14869 adhesion to human intestinal epithelial cells.
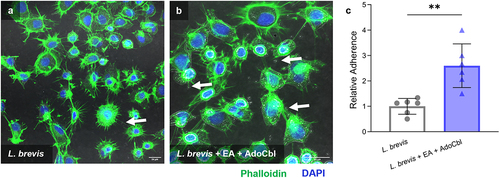
Figure 9. Ethanolamine (EA) enhances the ability of L. brevis ATCC 14869 to competitively exclude Salmonella Typhimurium LT2 from binding human intestinal epithelial cells.
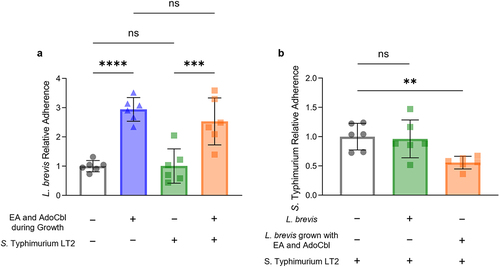
Table A1. Levilactobacillus brevis ATCC 14869 qPCR primer sequences.
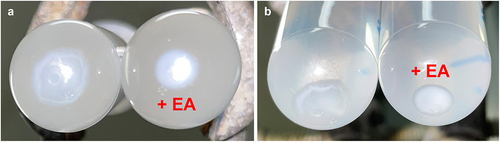
Figure A1. Ethanolamine promotes in vitro aggregation of Levilactobacillus brevis ATCC 14869.
Data availability statement
Illumina RNA sequencing reads can be found in NCBI under BioProject accession number PRJNA1001957.