Figures & data
Figure 1. Gut microbiota composition was changed during vascular calcification in chronic kidney disease (CKD) rats, presenting higher prevotella copri (P. copri) abundance. (a) Gut microbial α diversity (Chao 1, observed species, PD whole tree and Shannon index) among CKD and Model groups. (b) Principal component analysis plot of unweighted UniFrac distances between 2 groups. (c) Linear discriminant analysis effect size showed bacterial taxa with significantly different abundances between 2 groups. (d) Relative abundances of P. copri in 2 groups. Data are expressed as mean±SD, CKD = 5, Model = 5. **p < .01 and ***p < .001 by Student’s t-test.
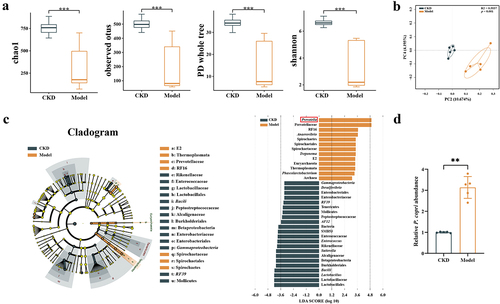
Figure 2. Correlation analysis of the prevotella copri (P. copri) abundance with calcification scores in chronic kidney disease (CKD) patients. (a) Aortic calcification in CKD patients was detected by computed tomography scan. (b) Relative abundances of P. copri in faeces. (c) Spearman’s correlation analyses of the association between P. copri in feces with calcification scores. Data are expressed as mean±SD, n = 18 per group. ***p < .001 by Student’s t-test.
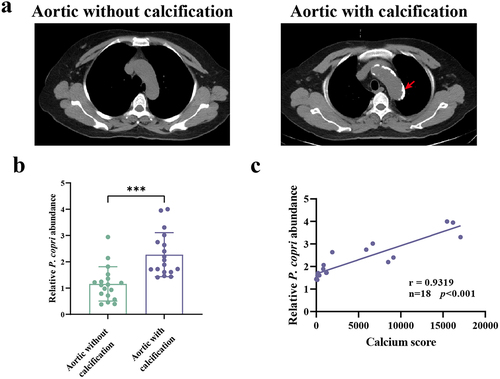
Table 1. Baseline characteristics of enrolled CKD patients.
Figure 3. Prevotella copri (P. copri) promoted aortic calcification in chronic kidney disease (CKD) rats. (a) Experimental design. (b) The bodyweight of rats was measured weekly. (c) Serum creatinine (SCr) levels were measured 2 weeks after surgery. (d) Relative abundances of P. copri in faeces were measured at the end of the experiment. (e) Micro-CT analysis of rat aortic calcification. Scale bar: 10 mm. (f) Representative image of Alizarin Red-stained aortas. Scale bar: 10 mm. (g) Representative image of Alizarin Red-stained aortic sections. Scale bar: 500 μm (upper) and 250 μm (lower). (h) Alizarin Red positive area was quantified by image J software. (i) Quantification of calcium content in aortas using a Ca assay kit. (j) Alkaline phosphatase (ALP) activity was assessed using an ALP activity assay kit. (k) Representative western blots of runt-related transcription factor 2 (RUNX2), bone morphogenetic protein-2 (BMP2), and α-smooth muscle actin (α-SMA). (l–n) Quantification of RUNX2, BMP2 and α-SMA protein expression by densitometry. Data are expressed as mean±SD, n = 5 per group. Not significant (ns), *p < .05, **p < .01 and ***p < .001 by one-way ANOVA with Bonferroni post hoc test.
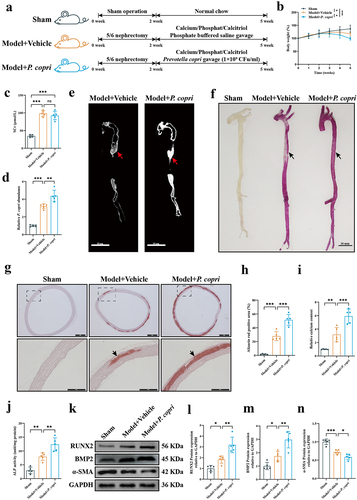
Figure 4. Effect of prevotella copri (P. copri) clearance by metronidazole on aortic calcification in chronic kidney disease (CKD) rats. (a) Experimental design. (b) The bodyweight of rats was measured weekly. (c) Serum creatinine (SCr) levels were measured 2 weeks after surgery. (d) Relative abundances of P. copri in faeces were measured at the end of the experiment. (e) Representative image of Alizarin Red-stained aortas. Calcium deposition in the aortas was stained with Alizarin Red solution. Scale bar: 10 mm. (f) Representative image of Alizarin Red-stained aortic sections. Scale bar: 500 μm (upper) and 250 μm (lower). (g) Alizarin Red positive area was quantified by image J software. (h) Quantification of calcium content in aortas using a Ca assay kit. (i) Alkaline phosphatase (ALP) activity was assessed using an ALP activity assay kit. (j) Representative western blots of RUNX2 (runt-related transcription factor 2) and α-smooth muscle actin (α-SMA). (k–l) quantification of RUNX2 and α-SMA protein expression by densitometry. Data are expressed as mean±SD, n = 5 per group. Not significant (ns), *p<.05, **p < .01 and ***p < .001 by one-way ANOVA with Bonferroni post hoc test.
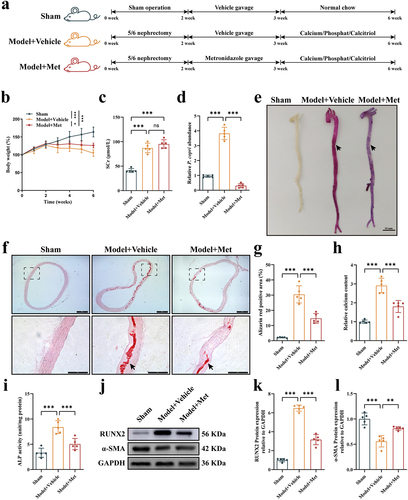
Figure 5. Prevotella copri (P. copri) damaged the gut barrier and promoted the translocation of bacterial lipopolysaccharide (LPS) in chronic kidney disease (CKD) rats with aortic calcification. (a–c) morphology of the ileum was assessed using hematoxylin and eosin staining (scale bar = 100 μm) and the average villus height and crypt depth was analyzed. (d–e) mRNA expression levels of intestinal tight junction proteins zonula occludens-1 (ZO-1) and Occludin in the three groups. (f) Representative western blots of ZO-1 and Occludin. (g–h) quantification of ZO-1 and Occludin protein expression by densitometry. (i) Levels of LPS in the peripheral blood. (j) Representative western blots of Toll-like receptor-4 (TLR4) in aortic tissues of rats. (k) Quantification of TLR4 protein expression by densitometry. (l) Representative western blots of TLR4 in vascular smooth muscle cells (VSMCs). (m) Quantification of TLR4 protein expression by densitometry. Data are expressed as mean±SD, n = 5 per group. *p < .05, **p < .01 and ***p < .001 by one-way ANOVA with Bonferroni post hoc test.
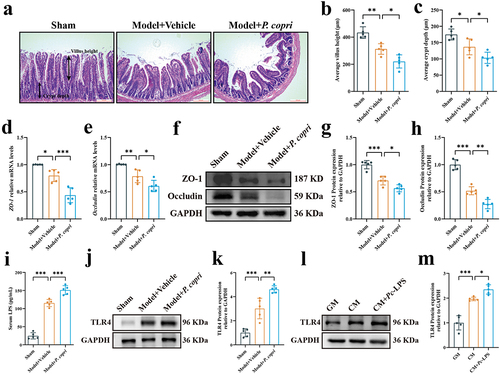
Figure 6. Lipopolysaccharide from Prevotella copri (pc-LPS) promoted vascular calcification in vitro and ex vivo. (a) Experimental design. (b) Representative images of Alizarin Red-stained vascular smooth muscle cells (VSMCs). Scale bar: 500 μm. (c) Quantitative analysis of alizarin red dye was performed by a microplate reader. (d) Quantification of calcium content using a Ca assay kit. (e) Alkaline phosphatase (ALP) activity was assessed using an ALP activity assay kit. (f–g) mRNA expression of runt-related transcription factor 2 (RUNX2) and α-smooth muscle actin (α-SMA). (h) Representative western blots of RUNX2 and α-SMA. (i-j) quantification of RUNX2 and α-SMA protein expression by densitometry. (k) Representative image of Alizarin Red-stained aortic sections. Scale bar: 500 μm. (l) Alizarin Red positive area was quantified by image J software. (m) Quantification of calcium content in aortas using a Ca assay kit. (n) ALP activity was assessed using an ALP activity assay kit. (o) Representative western blots for RUNX2 and α-SMA. (p-q) quantification of RUNX2 and α-SMA protein expression levels by densitometry. Data are expressed as mean±SD, n = 5 per group. *p < .05, **p < .01 and ***p < .001 by one-way ANOVA with Bonferroni post hoc test.
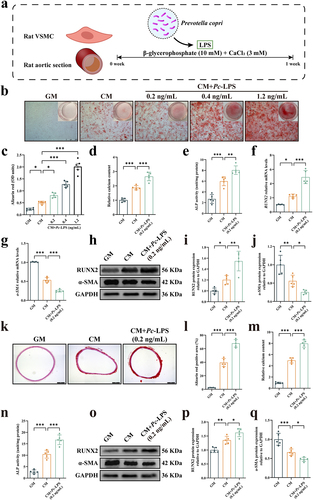
Figure 7. Activation of nuclear factor κB (NF-κB) was required for lipopolysaccharide from Prevotella copri (pc-LPS)-induced calcification of vascular smooth muscle cells (VSMCs). (a) Representative western blots of phosphorylated NF-κB (pNF-κB) and nucleotide-binding oligomerization domain, leucine-rich repeat and pyrin domain-containing 3 (NLRP3) of rat aorta. (b–c) quantification of pNF-κB and NLRP3 protein expression by densitometry. (d) The concentration of tumor necrosis factor-alpha (TNF-α), interleukin-6 (IL)-6 and IL-18 in rat aorta was determined by ELISA assay. (e) Representative western blots of pNF-κB and NLRP3 of VSMCs. (f–g) quantification of pNF-κB and NLRP3 protein expression by densitometry. (h) The concentration of TNF-α, IL-6 and IL-18 in VSMCs was determined by qRT-PCR. (i–q) VSMCs were incubated with pc-LPS in the presence of calcifying medium with or without NF-κB inhibitor pyrrolidinedithiocarbamate ammonium (PDTC). (l) Representative images of alizarin red-stained VSMCs. Scale bar: 500 μm. (j) Quantitative analysis of alizarin red dye was performed by a microplate reader. (k) Quantification of calcium content using a Ca assay kit. (l) ALP activity was assessed using an ALP activity assay kit. (m-n) mRNA expression of RUNX2 and α-SMA. (o) Representative western blots for RUNX2 and α-SMA. (p-q) Quantification of RUNX2 and α-SMA protein expression levels by densitometry. Data are expressed as mean±SD, n = 5 per group. *p < .05, **p < .01 and ***p < .001 by one-way ANOVA with Bonferroni post hoc test.
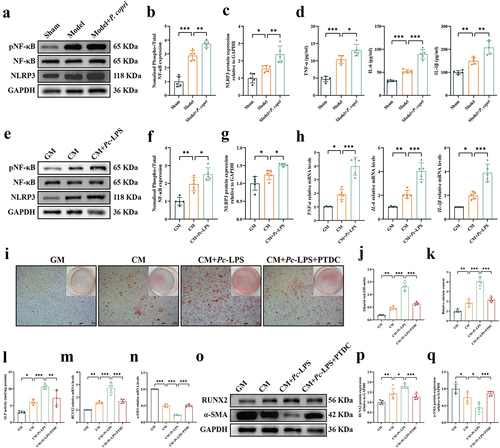
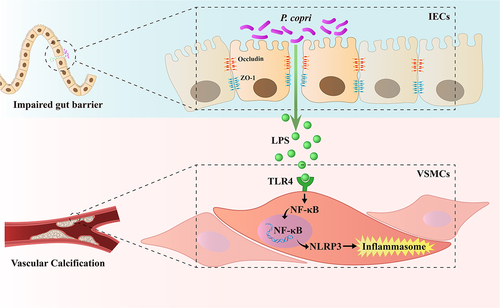
Figure 8. A schematic diagram of the mechanism of action. In rats with chronic kidney disease (CKD)-induced vascular calcification (VC), gut microbiota homeostasis is disrupted, evidenced by heightened prevotella copri (P. copri) levels and their increased lipopolysaccharide (LPS) content. Concurrently, there is an augmented expression of Toll-like receptor-4 (TLR4), a receptor specific to LPS. This imbalance leads to mucosal barrier disruption and subsequent gut ‘leakage,’ which activates nuclear factor κB (NF-κB) and nucleotide-binding domain, leucine-rich-containing family, pyrin domain-containing-3 (NLRP3) inflammasome signals and then instigates systemic inflammatory responses, further exacerbating VC.