
Figures & data
Figure 1. Microbial alterations in the control and NAFLD groups. (a) Alpha diversity analysis between the two groups. (b) Beta-diversity analysis showing different taxonomic compositions. (c) LEfSe depicting taxonomic association at the genus level. (d) Comparison of the relative abundance for the main detected genera. (e) Correlation analysis and hierarchical clustering of genus abundance with NAFLD-clinical indicators. (f) Linear regression analysis of the Enterococcus abundance and NAFLD-clinical indicators. Control (n = 78), NAFLD (n=78), error bars represented the mean ± SD, *p < .05, **p < .01.
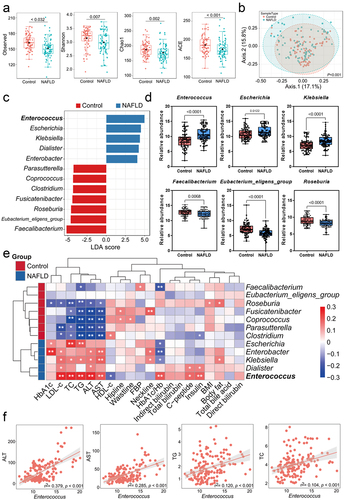
Table 1. Characteristics of the participants.
Figure 2. Colonization of E. faecium B6 promoted NAFLD symptoms in mice. (a) Schematic diagram of the isolation, identification, and screening of gut bacterial strain with lipogenic effects. (b) The procedure of mice experiments. (c) Changes in body weight among the NCD, NCD+B6, HFD, and HFD+B6 groups during 12 weeks. (d) Quantification of the liver index in mice. (e) Quantification of the steatosis score, inflammation score, ballooning score, and NAFLD activity score in mice. (f) Representative images of fixed liver sections with H&E, ORO, and masson staining, respectively. Magnification, × 200, the scale bar, 150 μm. (g-h) the concentrations of (g) serum and (h) hepatic ALT, AST, TG, TC, LDL-c, and HDL-c. N=8 per group, error bars represented the mean ± SD, *p < .05, **p < .01.
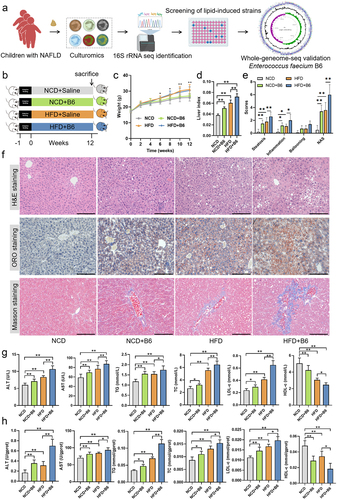
Figure 3. Transcriptomic analysis of liver tissues from the NCD, NCD+B6, HFD, and HFD+B6 groups. (a) Volcano plot of the DEGs distribution. Each dot represented a DEG. (b) Clustering and heatmap analysis of the DEGs between different groups. Colored bars indicate standardized log2 expression intensities (FPKM) of each sample in the NCD, NCD+B6, HFD, and HFD+B6 groups. Red and blue represent up-regulation and down-regulation, respectively. (c) Heatmap displaying the expression patterns of DEGs based on the transcriptomic data. Up-regulated or down-regulated genes are plotted in red or blue, respectively. Scale bars indicate a log2 fold change of gene expression in the HFD group compared with the NCD group, the NCD+B6 group compared with the NCD group, and the HFD+B6 group compared with the HFD group. (d) Validation of selected DEGs identified from the transcriptomic analysis using qRT-PCR. (e) The bubble plot illustrated the enriched KEGG pathways for DEGs between the NCD+B6 and NCD groups. (f) The bubble plot illustrated the enriched KEGG pathways for DEGs between the HFD+B6 and HFD groups. The dot’s color represented the Padj value, while the size of the dots represented the number of genes annotated to each KEGG term. N=8 per group, error bars show the mean ± SD, *p < .05, **p < .01. Scale bars, Z score log2 transformed intensity values.
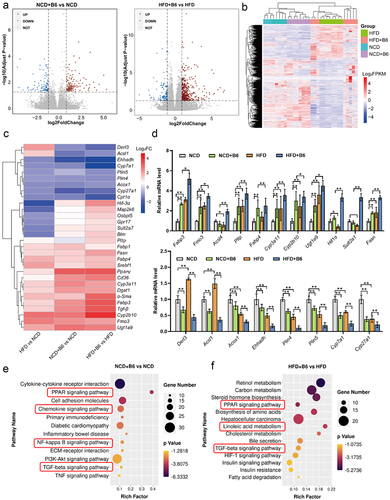
Figure 4. Expression analysis of mRNA and proteins related to the key signaling pathways. (a) The expression levels of key genes involved in the PPAR signaling pathway, TGF-beta signaling pathway, and inflammatory response using qRT-PCR analysis. (b) Western blot analyzed the expression of the key proteins. (c) Grey-scale quantitative analysis of western blotting. (d) Representative IHC staining of PPAR-γ, α-SMA, and IL-6 in the liver. Scale bar, 150 μm. (e) The concentrations of hepatic TNF-α, IL-6, and IL-1β based on ELISA analysis. (f) PPI network analysis of key genes related to NAFLD. N=8 per group, error bars represented the mean ± SD, *p < .05, **p < .01.
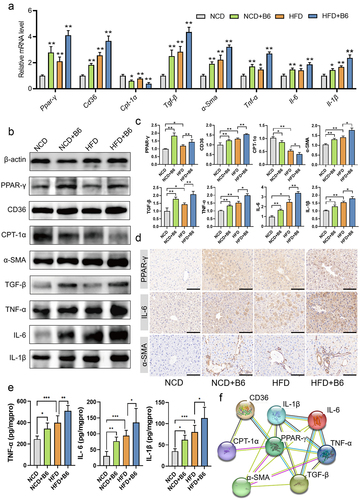
Figure 5. Metabolomic analysis of the metabolite profiles in mice. (a) OPLS-DA score plots of serum metabolite profiles in the NCD, NCD+B6, HFD, and HFD+B6 groups. (b) Volcano plot illustrating the altered metabolites. Each dot represented a metabolite. (c) The bubble plot of KEGG pathway enrichment analysis. (d) Alterations of common differential metabolites in the NCD+B6 group compared to the NCD group, and HFD+B6 group compared to the HFD group. (e) Alterations of specific metabolite levels in serum. (f) The concentration of tyramine in the serum and liver using the targeted quantitative determination. N=8 per group, error bars show the mean ± SD, *p < .05, **p < .01.
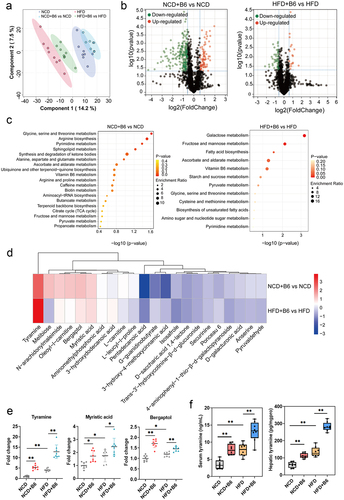
Figure 6. E. faecium B6-derived tyramine induced lipid accumulation and activated PPAR-γ. (a) Preparation of the metabolites. (b) Mass spectrogram of the identified tyramine in E. faecium B6 fermentation. (c) Relative concentrations of tyramine in the sterile BHI medium (the BHI group), E. faecium B6 cells (the B6 group), and cell-free supernatant of the E. faecium B6 fermentation (the SB6 group). (d) Ultra-high performance liquid chromatography system (UHPLC) analysis of the tyramine from E. faecium B6 and E. faecium B28. (e) Detection of mfnA gene in the genome of E. faecium B6 and E. faecium B28. (f-g) quantitative measurement of the levels of (f) mfnA and (g) tyramine in fecal samples of mice. (h-i) effects of tyramine (0, 5, 25, 50 μM) on intracellular lipid metabolism and liver function indexes in the (h) hepatocellular carcinoma cell lines (HepG2) and (I) human normal hepatocyte cell lines (THLE3). (j-k) effects of tyramine (0, 5, 25, 50 μM) on the expression of PPAR-γ and its target genes in the (j) HepG2 and (k) THLE3 cell lines. (l-m) effects of tyramine (0, 5, 25, 50 μM) on the transcriptional activity of PPAR-γ in the (l) HepG2 cells and (m) THLE3 cells measured with PPAR-γ transcription factor assay kit. Error bars represent the mean ± SD. *p < .05, **p < .01, ***p < .001.
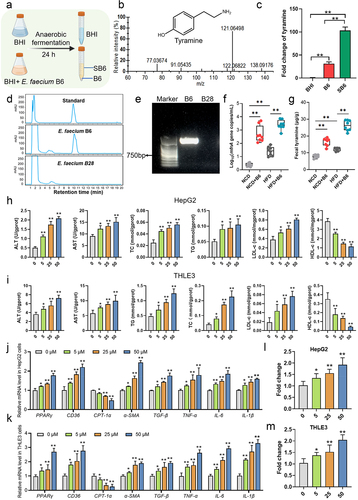
Figure 7. E. faecium B6-derived bioactive tyramine promoted NAFLD symptoms in mice. (a) Schematic diagram of the tyramine-treatment mice experiments. (b) Changes in body weight among the NCD, NCD+Tyr, HFD, and HFD+Tyr groups during. (c) Quantification of the liver index in mice. (d) Quantification of the steatosis score, inflammation score, ballooning score, and NAFLD activity score in mice. (e) Representative images of fixed liver sections with H&E, ORO, and masson staining, respectively. Magnification, × 200, the scale bar, 150 μm. (f) The concentrations of hepatic ALT, AST, TG, TC, LDL-c, and HDL-c. (g-i) the relative mRNA levels of Ppar-γ and its targeted genes involved in (g) lipid metabolism (Ppar-γ, Cd36, cpt-1α), (h) inflammatory response (tnf-α, il-6, il-1β), and (i) fibrosis (α-sma, tgf-β). (j) The transcriptional activity of PPAR-γ in mice livers was measured with the PPAR-γ transcription factor assay kit. (k-m) the concentrations of hepatic PPAR-γ and proteins involved in (k) lipid metabolism (PPAR-γ, CD36, CPT-1α), (l) inflammatory response (TNF-α, IL-6, IL-1β), and (m) fibrosis (α-SMA, TGF-β) based on ELISA analysis.
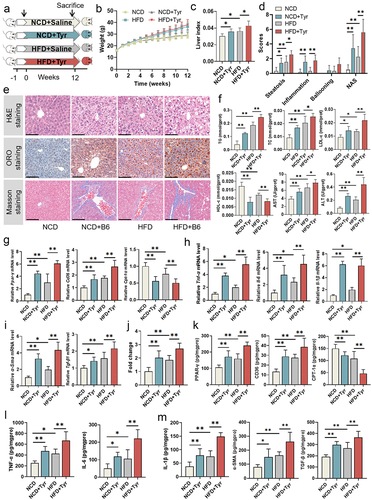
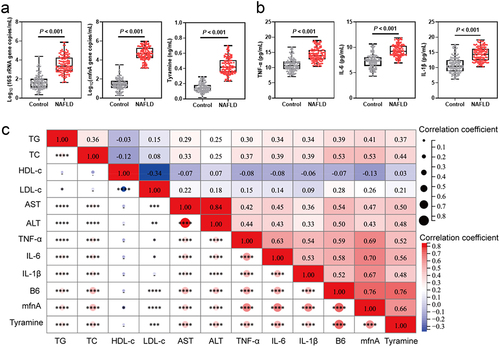
Figure 8. The association of E. faecium B6 and its bioactive metabolite tyramine with NAFLD in the validation cohort. (a) The levels of E. faecium B6, tyramine-producing gene (mfnA), and tyramine. (b) The concentration of inflammatory factors (TNF-α, IL-6, IL-1β). (c) The correlation analysis of the E. faecium B6, mfnA, tyramine, inflammatory cytokines, and NAFLD-clinical indicators. Control (n = 123), NAFLD (n=123), error bars represented the mean ± SD, *p < .05, **p < .01, ***p < .001.
Supplemental Material
Download Zip (3 MB)Data availability statement
All of the sequencing data that support the findings of the study are openly available in the National Center for Biotechnology Information (NCBI) BioProjects (https://www.ncbi.nlm.nih.gov/bioproject/) with the accession numbers PRJNA838778 and PRJNA1032872. Additional data that support the findings of this study are available on request from the corresponding author.