
Figures & data
Figure 1. Growth profiles after 24 hours of incubation (top panel) and corresponding gene map (bottom panel) of B. longum subsp. longum strains B. longum subsp. longum strains (names indicated below the top panel) were cultivated for 24 h in mMRS containing particular carbohydrates (indicated on the right-hand margin in the top panel) and growth is indicated in blue color coding based on OD readings as indicated. Bottom panel displays the presence/absence of genes involved in the metabolism of plant glycans in the corresponding genomes of the B. longum strains, where yellow indicates presence and black absence. The cutoff presence or absence of the gene/enzyme was set to E-value of 0.0001, with at least 50% identity across at least 50% of either protein sequence.
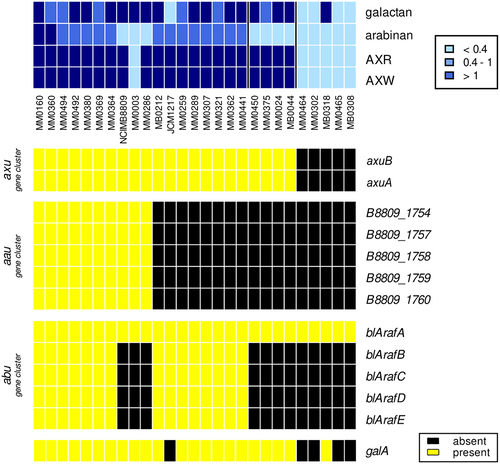
Figure 2. Growth abilities of B. longum subsp. longum NCIMB 8809 and derivatives with genes from the abu gene clusterOd600nm after 24 hours anaerobic growth in mMRS + 0.5% (w/v) arabinan or arabinose. Asterisks represent a significant difference (p ≤ 0.001***, p ≤ 0.01**) and NS indicates no significant difference (p ≥ 0.05).
Figure 3. Heatmap of differential expressed genes differential expressed genes (DEGs) in B. longum subsp. longum NCIMB 8809, with significant levels of change in their degree of log2 fold expression, when comparing arabinose (left) or AXR (right) to a lactose control. Red: negative log2 fold change (down-regulated), gray: zero log2 fold change, blue positive log2 fold change (up-regulated), and white no significant change under these conditions.
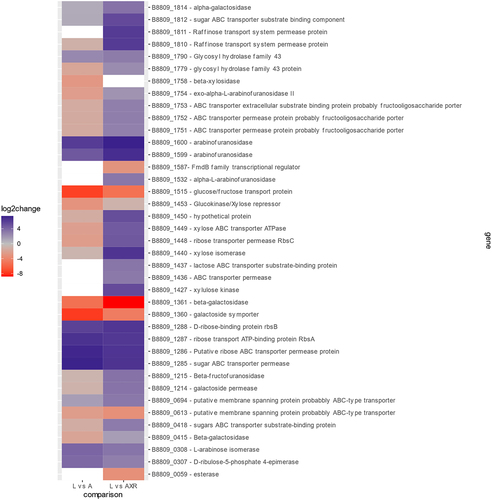
Figure 4. Schematic display of the axu gene cluster and neighboring genes in B. longum subsp. longum NCIMB 8809. (panel A). Illustration of the domains present in AxuA (panel B) and AxuB (panel C), predicted by TMHMM, SignalP, and HMMER; T: transmembrane domain; S: signal peptide; CBD: carbohydrate binding domain; M: sortase motif.
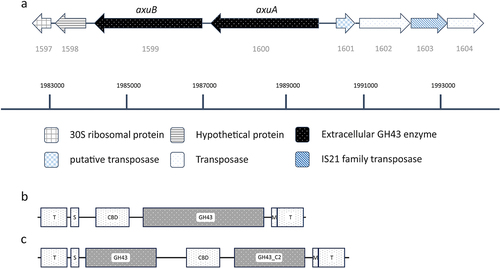
Table 1. Summary of obtained Kcat/Km values of AxuAHis and AxuBHis.
Figure 5. HPAEC-PAD analysis of hydrolysis products of AX incubated with AxuAHis/AxuBHis–AXW (panel A), AXR (panel B). From bottom to top: substrate only (gray), with AxuBHis (red), with AxuAHis (black), with both (blue) after 30 min. In box: amount (g/L) of release monomeric L-arabinose of 1 mM enzyme after 30 min of incubation.
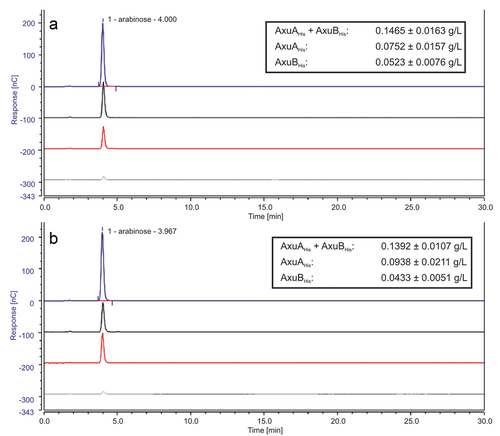
Figure 6. HPAEC-PAD analysis of products from enzymatic reactions of synthetic AX with and without incubation with AxuAHis/AxuBHis see SM6; from the bottom to top: substrate only (gray), with AxuBHis (red), with AxuAHis (black), with both (blue); utilizing A2XX (panel A), A3X (panel B) and A23XX (panel C); the structures of tested synthetic AX are shown in the top-right hand corner. Green Stars indicated arabinose residues and orange stars correspond to xylose units. (structures created with BioRender.com).
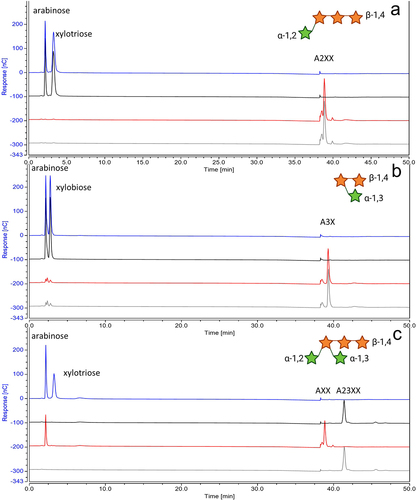
Figure 7. Growth profile of B. longum subsp. longum NCIMB 8809 mutant and transformants with genes from the axu gene cluster OD600 nm after 24 hours anaerobically grown in mMRS + 0.5% (w/v) arabinose, AXR, AXW, and lactose. Asterisks represent a significant difference (p ≤ 0.001***) and NS indicates no significant difference (p ≥ 0.05).
Figure 8. Growth profile of B. longum subsp. longum MM0464 transformants with genes from the axu gene cluster OD600 nm after 24 hours anaerobically grown in mMRS + 0.5% (w/v) arabinose, AXR, AXW, and lactose. Asterisks represent a significant difference (p ≤ 0.001***, p ≤ 0.01**, p ≤ 0.05*) and NS indicates no significant difference (p ≥ 0.05).
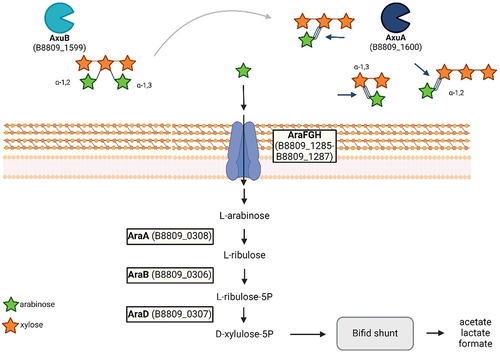
Figure 9. Model of AX degradation of AxuA and AxuB and arabinose metabolism in B. longum susp. longum locus tags for genes in B. longum susp. longum NCIMB8809, see text for further details. Created with BioRender.com.
Supplemental Material
Download MS Word (3.7 MB)Data availability statement
The sequencing data that support the findings of this study are openly available in NCBI at https://www.ncbi.nlm.nih.gov/ within the BioProject PRJNA1073879 and PRJNA1082215.