
Figures & data
Figure 1. ISCs and differentiated progeny in the small intestine. (a) Active ISCs feed daughter cells into the transit-amplifying compartment, and TA cells differentiate into mature intestinal epithelial cells, including absorptive and secretory cells. Quiescent ISCs can be converted to active ISCs to promote intestinal epithelial repair. (b) Villus-crypt axis structure of the small intestine. Intensity gradient of the four crucial signaling pathways for ISC maintenance along the villus-crypt axis. This figure was drawn using online Figdraw software (https://www.figdraw.com/#/).
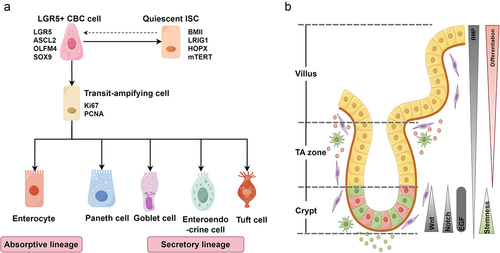
Figure 2. Essential signaling pathway regulating ISC fate. The principal Wnt, Notch, BMP, and EGF signaling cascades collectively regulate ISC behavior and homeostasis. Further details are provided in the main text. This figure was drawn using online Figdraw software (https://www.figdraw.com/#/).
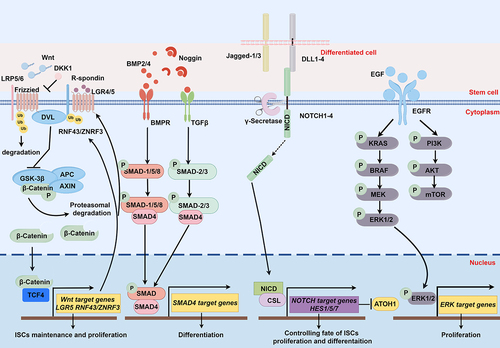
Figure 3. The effects of key microbiota-derived metabolites on ISCs and the pathways that control gut homeostasis. Microbiota-derived metabolites, such as SCFAs, lactate, succinate, indoles and their derivatives, and bile acids, play a crucial role in regulating ISC homeostasis and associated signaling pathways. Further details are provided in the main text. This figure was drawn using online Figdraw software (https://www.figdraw.com/#/).
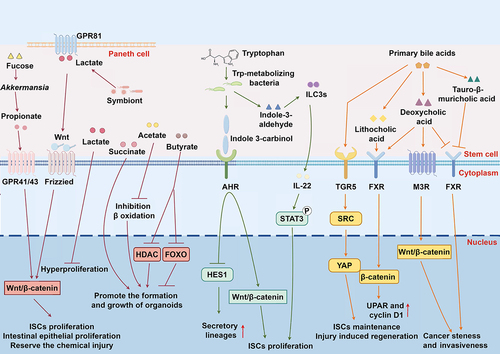
Table 1. Effects of intestinal microbiota-derived metabolites on ISCs.
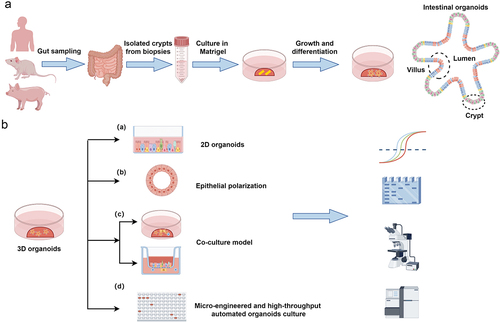
Figure 4. The establishment and engineering improvement of the intestinal organoid model. (a) Flowchart of the establishment of the mammalian intestinal organoid model. Intestinal crypts were isolated from intestinal tissue, and further embedded in Matrigel® with culture medium to form intestinal organoids. (b) Engineering improvement of the intestinal organoid model. (a) 2D organoids; (b) intestinal organoid polarization; (c) co-culture of intestinal organoids with intestinal mesenchymal and immune cells. (d) High-throughput automated organoid culture. Phenotypic analysis, RT-PCR, imaging, single-cell RNA sequencing, and other indicators can be used to evaluate organoid function. This figure was drawn using online Figdraw software (https://www.figdraw.com/#/).
Data Availability statement
Data sharing is not applicable to this article, as no datasets were generated or analyzed in the current study. were created using Figdraw software (www.figdraw.com).