
Figures & data
Figure 1. Gut microbiota isolate whole-genome sequencing (WGS) similarity and Salmonella co-culture experimental workflow.
(a) Schematic representation of the ACHIM isolates and Salmonella co-culture experiment workflow. We isolated 112 bacteria from the ACHIM culture by sequential dilution and obtained 74 different ACHIM isolates. Bioinformatic analysis of WGS data for these isolates enabled the selection of 15 ACHIM isolates for co-culture with Salmonella to identify isolates capable of inhibiting Salmonella growth. (b) Average nucleotide identity similarity matrix for the 74 gut microbiota isolates that passed bioinformatic filtering and contamination screens. The heatmap color scale indicates the calculated Pearson Correlation Coefficients of all pairwise average nucleotide identity (ANI) comparisons between isolate WGS assemblies. Positive values closer to 1 indicate high genome sequence similarity and negative values closer to -1 indicate lower genome sequence similarity. Isolates are hierarchically clustered based on similarity in correlation coefficient profiles.
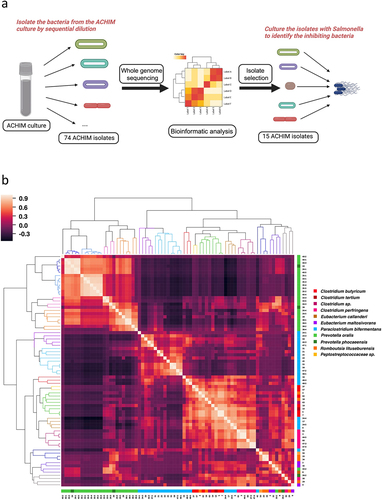
Figure 2. Gut microbiota isolates selectively reduce Salmonella growth.
(a) MinHash genome distance and best-match WGS reference genome assignment. Heatmap values indicate the Jaccard Similarity Index (JSI) between WGS genome sketches. Values closer to 1 (darker) indicate higher similarity in nucleotide composition and values closer to 0 indicate low genome similarity. The genome taxonomy database (GTDB) bar annotations indicate the JSI between gut microbiota isolates and the most similar reference organism in the GTDB r202. (b-c) Quantification by colony forming units (CFU) of Salmonella growth at 24 and 48 h after co-culture. Representative images on the upper right showed the growth of Salmonella on Salmonella-selective agar plates under aerobic condition (purple color colonies). The treatment conditions were stated above the plates, and each bacterial line represented a serially
diluted concentration of Salmonella at 24 and 48 hours after co-culture (0 to 105 dilution of 10ul culture from lef to right). Representative images on the lower right showed the growth of total bacteria on YCFA agar plates under anaerobic condition (ochre color colonies). Bacteria quantifications of each co-culture mix were compared with the Salmonella growth in the culture medium without mixing with other bacteria by Kruskal–Wallis one-way ANOVA. Data were represented as mean ± SD in a log scale from three independent assays with triplicates. *p < .05, **p < .01, ***p < .001 and ****p < .0001.
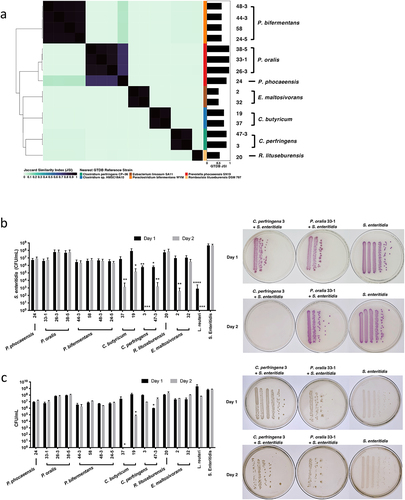
Figure 3. Evaluation of the functional genomic potentials among gut microbiota isolates.
(a) Principal coordinate analysis (PCoA) of KEGG pathway completion profiles for the 15 isolates selected for downstream functional analyses (left) and six isolates assigned to
the “Kill” and “No-Kill” groups based on results from the Salmonella co-culture assays (right). The KEGG pathway completion profile for each isolate consisted of the 36 pathways surviving conditional filtering in R. Colors indicate the WGS-based taxonomic classification of each isolate at the genus level or the phenotypic group. (b) Hierarchical clustering of KEGG pathway completion profiles for the six isolates assigned to the “Kill” and “No-Kill” groups based on results from the Salmonella co-culture assays. Heatmap color indicates percent completion for each of the 36 selected metabolic pathways, expressed as a fraction (0 – 1). Darker colors correspond to higher metabolic pathway completion with lighter colors corresponding to less complete pathways.
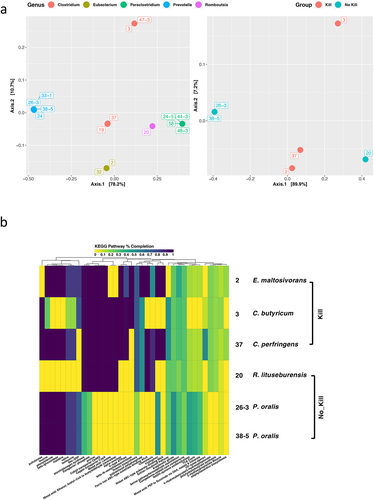
Figure 4. Metabolites unique in co-culture systems inhibiting Salmonella growth.
(a-b) Schematic representation of the metabolomic analysis of the co-culture system and the following functional assays. The metabolite profile of the co-culture system of gut commensal isolates and Salmonella by an ultra-performance liquid chromatography-tandem mass spectrometry (UPLC-MS/MS)
method was analyzed to identify the up- and down-regulated compounds in the co-culture system compared to the Salmonella control group. The impact of the altered compounds on Salmonella growth inhibition by culturing Salmonella with these compounds for 24 h was tested. Finally, the effect of the top candidates on other pathogens including multidrug-resistant pathogens was investigated. (c) Principal component analysis of the “Kill” vs. “No Kill” groups. (d) Heatmap of top 25 features (ranked by p-value) from the comparison between the “Kill” and “No Kill” groups. Darker red indicates higher concentration of the metabolites and darker blue indicates lower concentration of the metabolites. (e) Representative extracted ion chromatogram (EIC) of the adenosine from the “Kill” (blue lines) vs. “No Kill” groups (red lines). (f) Variations of mass spectrometric intensities between bacterial groups of the four validated metabolites adenosine, valyl-proline, hypoxanthine, and urocanic acid. Data were analyzed by one-way ANOVA with Tukey’s multiple comparison test. The significance indicated above each group is from the comparison with the Salmonella control group. *p < .05, **p < .01, ***p < .001 and ****p < .0001.
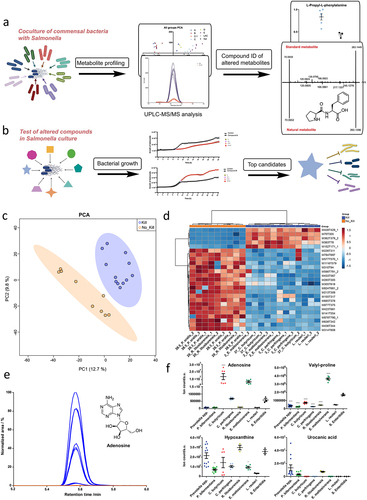
Figure 5. Adenosine and adenine are potent inhibitors of multiple-antibiotic-resistant pathogens.
(a) The growth of Salmonella co-cultured with adenosine or adenine for 24 h was compared with its growth in culture medium without adenosine. Data was analyzed
by two-way repeated measures (RM) ANOVA with post hoc test Tukey’s multiple comparisons test. (b-e) The effects of the adenosine or adenine on the growth of listed pathogens for 24 h were compared with the growth of the pathogens in culture media without adenosine or adenine. (f) The effects of adenosine or adenine in combination with ampicillin on the growth of E. coli 25218. The CFUs were inferred from the OD values (OD = 1 equals Salmonella enteritidis PT4: 5 × 10⁸ CFU, Salmonella Typhimurium: 1.7 × 10⁸ CFU, Staphylococcus aureus: 1.7 × 10⁸ CFU, E. Coli ST131: 2.1 × 10⁸ CFU, E. coli 35218: 2.8 × 10⁸ CFU, Klebsiella pneumoniae 25955: 3.7 × 10⁸ CFU). Three independent assays were performed, and the data from the mean ± SD of triplicates from one presentative experiment was shown. *p < .05, **p < .01, ***p < .001, ****p < .0001. (g) Correlogram visualization of Spearman Rank correlation analysis of 36 KEGG pathways surviving conditional filtering and metabolite abundance values and the 12 compounds presented in and Fig. S3. Each correlation calculation included values from the six isolates assigned to the “Kill” and “No-Kill” groups based on results from the Salmonella co-culture assays. Significant correlations are marked with an asterisk (p < .05). Plot labels with the prefix, ‘KEGG:’ distinguish KEGG metabolic pathway completion variables from those that represent metabolic compound abundances. Metabolite abundance values represent the average abundance over triplicate sampling. Larger circles show higher correlation coefficients, with blue corresponding to positive correlations and red to negative correlations.
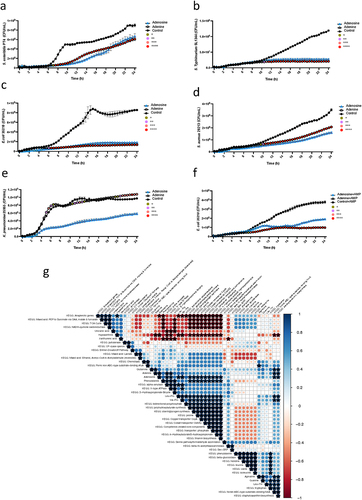
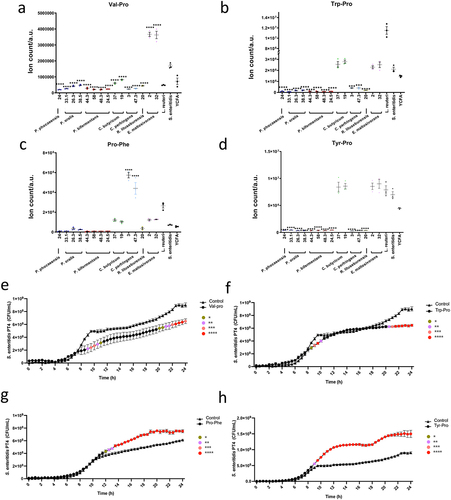
Figure 6. Dipeptides demonstrated the opposite function in Salmonella growth.
(a-d) Level of the identified Val-Pro (a), Trp-Pro (b), Pro-Phe (c), and Tyr-Pro (d) by ultrahigh-performance liquid chromatography-tandem mass spectrometry (UPLC-MS/MS) in each co-culture supernatant of gut commensal isolates and Salmonella. Data were analyzed by one-way ANOVA with Tukey’s multiple comparison test. The significance indicated above each co-culture comes from the comparison with the Salmonella control group. *p < .05, **p < .01, ***p < .001, ****p < .0001. (e-h) The growth of Salmonella co-cultured with Val-Pro (e), Trp-Pro (f), Pro-Phe (g), and Tyr-Pro (h) for 24 h was compared with its growth in culture medium without dipeptide. The CFUs were inferred from OD value. Data were analyzed by two-way repeated measures (RM) ANOVA with post hoc test Tukey’s multiple comparison test. Three independent assays were performed, and the data from the mean ± SD of triplicates from one presentative experiment was shown. *p < .05, **p < .01, ***p < .001, ****p < .0001.
Supplemental material