
Figures & data

Table 1. Inclusion and exclusion criteria for the Probiotics study.
Table 2. Inclusion and exclusion criteria for the Prebiotics study.
Figure 1. PRISMA flow diagram showing the systematic review process with the bibliometric assessment, including article attrition and study selection.
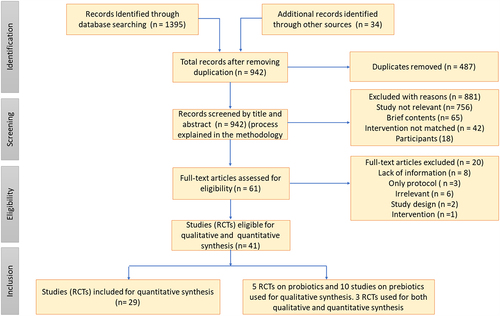
Table 3. Types and dosages of probiotics.
Figure 2. Forest plot for the intervention group (probiotics) vs. placebo for the decolonization success at the end of the study or at a 1-month time point. The I2 values are interpreted as low, moderate, and high levels of heterogeneity, where I2 = 0–49%, I2= 50–75%, and I2 > 75%.Citation19,Citation53 A 5% significance level (p<0.05) was used to determine the significant difference between the treatment efficacies. The events consist of the persistence of bacteria.
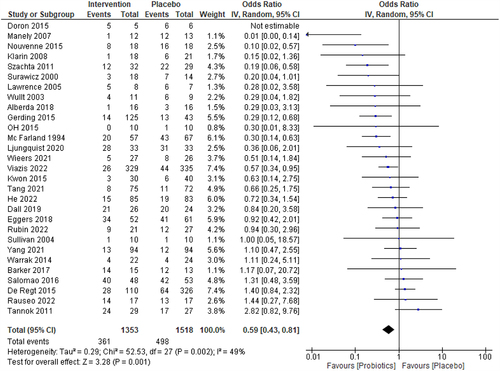
Figure 3. Forest plot of the sub-group analysis for the efficacy of probiotics concomitant with or without conventional medicine. The I2 values are interpreted as low, moderate, and high levels of heterogeneity, where I2 = 0–49%, I2= 50–75%, and I2> 75%, respectively.Citation19,Citation53 A 5% significance level (p<0.05) was used to determine the significant difference between the treatment efficacies. The events consist of the persistence of bacteria.
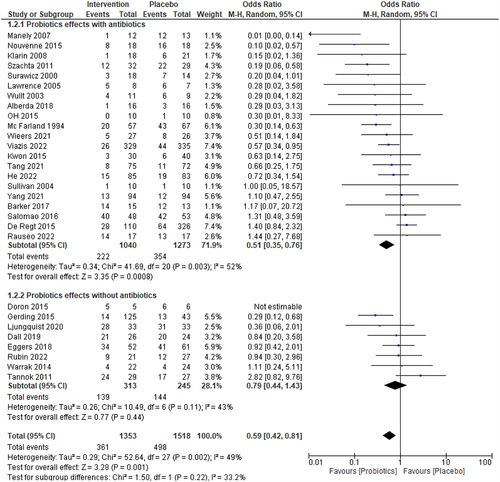
Figure 4. Forest plot of the sub-group analysis for the efficacy of specific probiotics Lactobacillus, Mixed probiotics, S. boulardii, and other probiotics vs placebo. The I2 values are interpreted as low, moderate, and high levels of heterogeneity, where I2 = 0–49%, I2= 50–75%, and I2> 75%, respectively.Citation19,Citation53 A 5% significance level (p<0.05) was used to determine the significant difference between the treatment efficacies. The events consist of the persistence of bacteria.
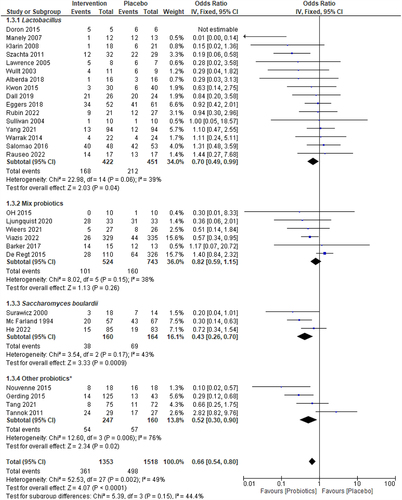
Figure 5. Forest plots for sub-group analysis of the efficacy of the intervention (Probiotics) vs. Placebo on C. difficile, MDR-Enterobacteriaceae, VRE, and H. pylori. The I2 values are interpreted as low, moderate, and high levels of heterogeneity, where I2 = 0–49%, I2= 50–75%, and I2> 75%, respectively.Citation19,Citation53 A 5% significance level (p<0.05) was used to determine the significant difference between the treatment efficacies. The events consist of the persistence of bacteria.
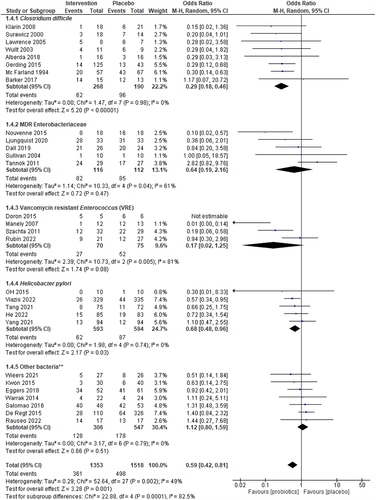
Figure 6. Results of the meta-regression of the covariates, dosages of probiotics, and types of probiotics and types of bacteria on the decolonization of pathogens.
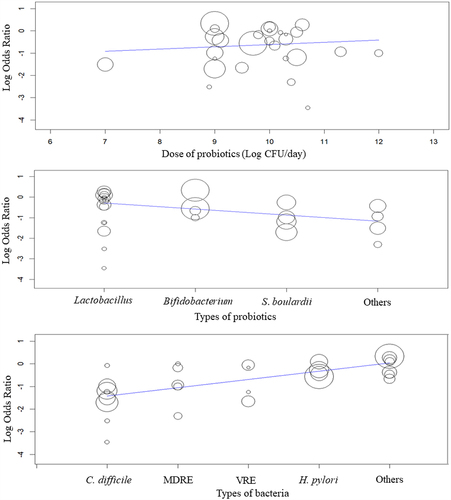
Table 4. Moderation effect of the covariates of probiotic intervention, types of probiotics, pathogens, regions, and dosages of probiotics on the effect size of pathogenic decolonization.
Figure 7. Funnel plot of comparison: efficacy of pathogenic bacteria decolonization.
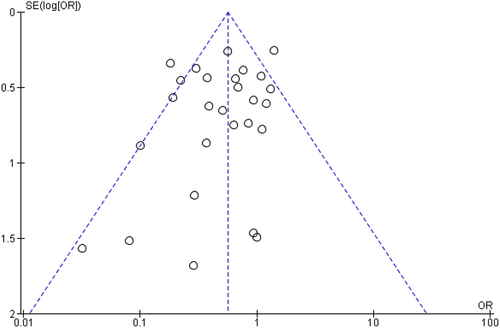
Table 5. Publication bias summary.
Table 6. GRADEpro summary of findings for assessing the quality of evidence as assessed separately by two independent reviewers.
Table 7. Types and dosages of prebiotics.
Table 8. Metagenomic analysis outcome on alpha diversity for probiotic intervention.
Table 9. Metagenomic analysis outcome on the microbiome composition for probiotic intervention.