976
Views
0
CrossRef citations to date
0
Altmetric
Research Paper

The role of Bifidobacterium genus in modulating the neonate microbiota: implications for antibiotic resistance acquisition in early life

ORCID Icon, ORCID Icon, ORCID Icon & ORCID Icon
Article: 2357176 | Received 17 Dec 2023, Accepted 15 May 2024, Published online: 26 May 2024

Figures & data

Table 1. Characteristics of study participants.

Figure 1. Principal coordinates analysis of the hierarchical clustering of Bifidobacterium relative abundance of the infants at (a) 7 days and (b) 1 month of age based on Bray Curtis distances regarding the microbial community composition (p < .001; ADONIS pairwise test). Samples are grouped by hierarchical clustering of Bifidobacterium relative abundance in intestinal microbiota. Orange ellipses represent the high-Bifidobacterium groups and blue ellipses represent low-Bifidobacterium groups. Supplementary figure 2 provides the optimal number of clusters found by the elbow and average silhouette methods of K-means partitioning clustering algorithm.
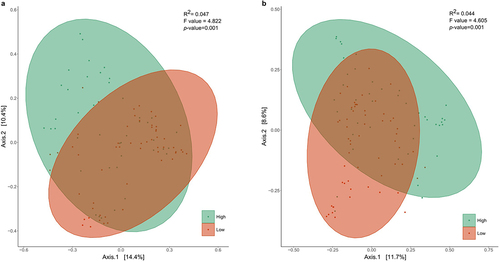
Figure 1. Principal coordinates analysis of the hierarchical clustering of Bifidobacterium relative abundance of the infants at (a) 7 days and (b) 1 month of age based on Bray Curtis distances regarding the microbial community composition (p < .001; ADONIS pairwise test). Samples are grouped by hierarchical clustering of Bifidobacterium relative abundance in intestinal microbiota. Orange ellipses represent the high-Bifidobacterium groups and blue ellipses represent low-Bifidobacterium groups. Supplementary figure 2 provides the optimal number of clusters found by the elbow and average silhouette methods of K-means partitioning clustering algorithm.

Figure 2. Microbial composition according to Bifidobacterium-abundance groups. Differences in relative abundance (%) of the 8 most abundant genera in fecal microbiota (more than 5% of relative abundance) among the first 7 days (a) and 1 month of life (b). Asterisks (*) indicate a significant difference between groups based on Mann–Withney U of the log-transformed relative abundances. Supplementary tables 5 and 6 provide genus abundances and statistical analyses of the groups for the two time points. Linear discriminant analysis (LDA) Effect Size (LEfSE) plot of taxonomic biomarkers identified in the gut microbiota of infants of 7 days (c) and 1 month (d) of age, according to Bifidobacterium dominance cluster (High and Low colored in green and orange, respectively). The threshold for the logarithmic discriminant analysis (LDA) score was 3 and p < .05 for Wilcoxon test was considered significant.
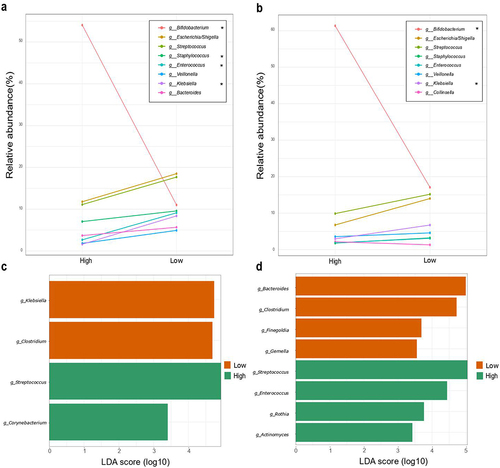
Figure 2. Microbial composition according to Bifidobacterium-abundance groups. Differences in relative abundance (%) of the 8 most abundant genera in fecal microbiota (more than 5% of relative abundance) among the first 7 days (a) and 1 month of life (b). Asterisks (*) indicate a significant difference between groups based on Mann–Withney U of the log-transformed relative abundances. Supplementary tables 5 and 6 provide genus abundances and statistical analyses of the groups for the two time points. Linear discriminant analysis (LDA) Effect Size (LEfSE) plot of taxonomic biomarkers identified in the gut microbiota of infants of 7 days (c) and 1 month (d) of age, according to Bifidobacterium dominance cluster (High and Low colored in green and orange, respectively). The threshold for the logarithmic discriminant analysis (LDA) score was 3 and p < .05 for Wilcoxon test was considered significant.
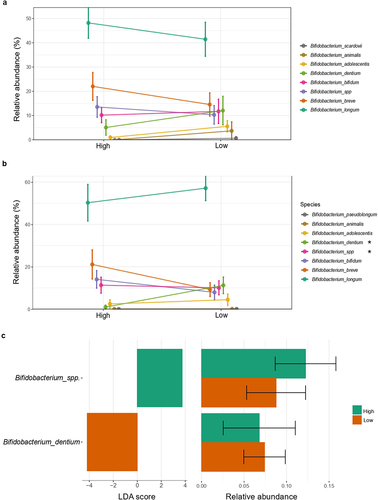
Figure 3. Bifidobacterium spp. relative abundance according to Bifidobacterium relative abundance group. Differences in relative abundance (%) of species of Bifidobacterium identified in fecal microbiota among the (a) first 7 days and (b) 1 month of life. (c) Linear discriminant analysis (LDA) Effect Size (LEfSE) plot of Bifidobacterium species identified in the gut microbiome of 1-month-old infants and their relative abundances. Species bacterial traits found at Bifidobacterium species level according to Bifidobacterium dominance cluster (High and Low coloured in green and orange, respectively). The threshold for the logarithmic discriminant analysis (LDA) score was 3 and p < .05 for Wilcoxon test was considered significant.

Figure 3. Bifidobacterium spp. relative abundance according to Bifidobacterium relative abundance group. Differences in relative abundance (%) of species of Bifidobacterium identified in fecal microbiota among the (a) first 7 days and (b) 1 month of life. (c) Linear discriminant analysis (LDA) Effect Size (LEfSE) plot of Bifidobacterium species identified in the gut microbiome of 1-month-old infants and their relative abundances. Species bacterial traits found at Bifidobacterium species level according to Bifidobacterium dominance cluster (High and Low coloured in green and orange, respectively). The threshold for the logarithmic discriminant analysis (LDA) score was 3 and p < .05 for Wilcoxon test was considered significant.

Figure 4. Environmental factors contributing to Bifidobacterium-specific microbiota. Significance and explained variance of 6 microbiota covariates modeled by ‘envfit’ across all data types for each time point: for (a) 7 days old and for (c) 1 month old. Horizontal bars show the amount of variance (R2) explained by each covariate in the model as determined by ‘envfit’. The groups within each covariate are detailed in Table 1. Covariates are gradient-colored based on R2. Significant covariates (false discovery rate (FDR) p < .05) are represented in bold. Asterisks (*) denotes the significant covariates at each time point: * p < .05, ** p < .01, *** p < .001. kmeans: hierarchical clusterization based on k-means according to Bifidobacterium relative abundance; AB_birth: antibiotic exposure at birth; AB_pregnancy: antibiotic exposure of the mother during pregnancy; AB_exposure: antibiotic exposure of the infant during his life; Delivery_mode: mode of delivery; Lactation_mode: mode of lactation. Dissimilarities in gut microbiota composition according to Bifidobacterium relative abundance (High or Low) represented by nonmetric multidimensional scaling (NMDS) of zOTU relative abundances for infants (b) 7 days and (d) 1 month of age. The centroids of each group are in blue (Low) and yellow (High). The top contributing categorical variables are displayed as arrows, with a length proportional to the correlation between the variable and the NMDS ordination. (e) Multivariable association between factors and taxonomy in both clusters while accounting for potentially confounding covariates using MaAsLin.
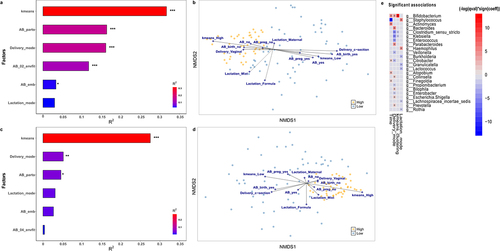
Figure 4. Environmental factors contributing to Bifidobacterium-specific microbiota. Significance and explained variance of 6 microbiota covariates modeled by ‘envfit’ across all data types for each time point: for (a) 7 days old and for (c) 1 month old. Horizontal bars show the amount of variance (R2) explained by each covariate in the model as determined by ‘envfit’. The groups within each covariate are detailed in Table 1. Covariates are gradient-colored based on R2. Significant covariates (false discovery rate (FDR) p < .05) are represented in bold. Asterisks (*) denotes the significant covariates at each time point: * p < .05, ** p < .01, *** p < .001. kmeans: hierarchical clusterization based on k-means according to Bifidobacterium relative abundance; AB_birth: antibiotic exposure at birth; AB_pregnancy: antibiotic exposure of the mother during pregnancy; AB_exposure: antibiotic exposure of the infant during his life; Delivery_mode: mode of delivery; Lactation_mode: mode of lactation. Dissimilarities in gut microbiota composition according to Bifidobacterium relative abundance (High or Low) represented by nonmetric multidimensional scaling (NMDS) of zOTU relative abundances for infants (b) 7 days and (d) 1 month of age. The centroids of each group are in blue (Low) and yellow (High). The top contributing categorical variables are displayed as arrows, with a length proportional to the correlation between the variable and the NMDS ordination. (e) Multivariable association between factors and taxonomy in both clusters while accounting for potentially confounding covariates using MaAsLin.

Figure 5. Redundancy Discriminant Analysis (RDA) biplot depicting the relationship between the bacterial communities and copies of ARGs. Coloured arrows represent differential bacteria and copies ARGs, colored dots represent samples from different groups. Angles between the arrows represent correlations; acute angles represent positive correlations and obtuse angles represent negative correlations. The black arrows are the ARGs that best explain the differences between the sample groups. The orange arrows are the taxa that best explain the differences between the sample groups (n = 9 taxa).
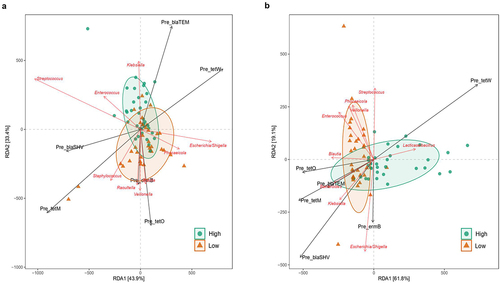
Figure 5. Redundancy Discriminant Analysis (RDA) biplot depicting the relationship between the bacterial communities and copies of ARGs. Coloured arrows represent differential bacteria and copies ARGs, colored dots represent samples from different groups. Angles between the arrows represent correlations; acute angles represent positive correlations and obtuse angles represent negative correlations. The black arrows are the ARGs that best explain the differences between the sample groups. The orange arrows are the taxa that best explain the differences between the sample groups (n = 9 taxa).

Figure 6. Spearman correlations between genera and copies of ARGs. Heat map to show Spearman correlations between copies of ARGs and microbiota composition at the genus level, divided by Bifidobacterium relative abundance clusters (High and Low) for infants of 7 days of age (a) and 1 month of age (b). Statistical differences are marked as follows: * p < .05, ** p < .01.
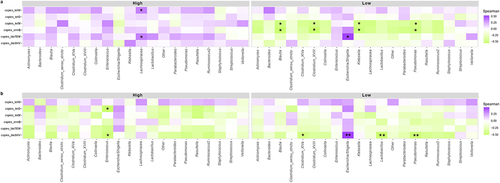
Figure 6. Spearman correlations between genera and copies of ARGs. Heat map to show Spearman correlations between copies of ARGs and microbiota composition at the genus level, divided by Bifidobacterium relative abundance clusters (High and Low) for infants of 7 days of age (a) and 1 month of age (b). Statistical differences are marked as follows: * p < .05, ** p < .01.
Supplemental material

Supplemental Material

Download Zip (1.4 MB)

Data availability statement

The dataset supporting the conclusions of this article is included in the NCBI’s Sequence Read Archive (SRA) repository in the MAMI BioProject ID PRJNA614975 (http://www.ncbi.nlm.nih.gov/bioproject/61497).