
Figures & data
Table 1. GI disease correlates with decreased fecal archaea.
Figure 1. Absence of archaea in stool correlates with decreased microbial diversity. (a–e) Comparison between stool samples with archaea (archaea-pos, blue) and without archaea (archaea-neg, orange) detected via qPCR in patient cohort 1. (a) NMDS plots of generalized unifrac distances of bacterial composition in all samples, controls, IBS- and UC-patients (from left to right), determined via 16S-rRNA sequencing. (b) Bacterial diversity as defined by Shannon’s index. (c) Bacterial richness. (d) Relative abundance of differential abundant bacterial OTUs. (e) Amplicon sequencing variant-based differences between archaea-high and archaea-low stool samples. Size of dots represent fold change, full-dots represent up-regulation in archaea positive samples, empty dots represent down-regulation. Dots are colored based on bacterial phylum. Statistical analysis: cohort 1, total n = 76 stool samples (50 archaea-neg, 26 archaea-pos; 23 controls, 37 IBS- and 16 UC-patients). (a) PERMANOVA of distance matrices. (b–d) Kruskal-Wallis rank sum test, with Benjamini-Hochberg correction for multiple comparisons. (e) DESeq2, only significant findings (p < .05 after correction for multiple comparisons) are shown. *p ≤ .05, **p ≤ .01.
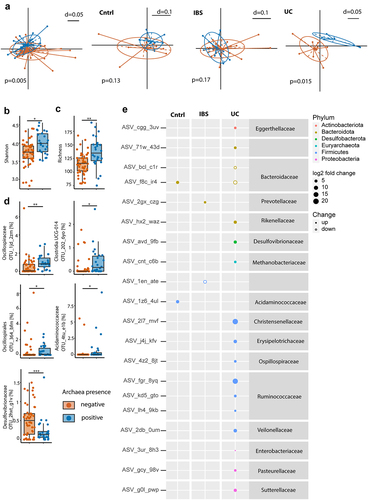
Figure 2. Presence of archaea in stool correlate with SCFA and BA homeostasis. (a,b,d,f) Comparison between archaea-pos (blue) and archaea-neg (orange) stool samples. (a) PCA plot of stool sample metabolite composition. (b) Volcano plot of metabolomics data, p-value threshold 0.05; log2 fold-change threshold ±1. (c) Small Molecule Pathway Database pathway enrichment ratios of metabolomics data. (d) Stool sample bile acid concentrations detected via HPLC-MS. (e) Correlation of fecal calprotectin and relative abundance of facultative anaerobes. (f) Number of bacteria within 3-μm distance from the epithelium detected via DAPI, normalized to length of epithelium per section as determined via confocal microscopy of colonic biopsies. (g) Archaea qPCR RQ values in patients with PPI intake (PPI, purple, n = 25) and no PPI intake in the previous five years (no-PPI, green, n = 37). Statistical analysis: (a–c) n = 5 archaea-pos and 5 archaea-neg stool samples. (d) Mann Whitney U test, n = 16 archaea-pos and 21 archaea-neg stool samples. (e) Linear regression analysis, n = 47 stool samples, *p ≤ .05; **p ≤ .01.
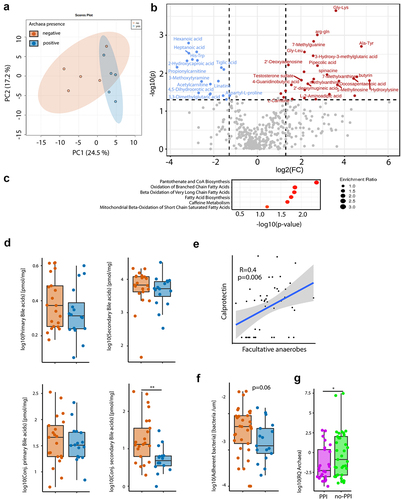
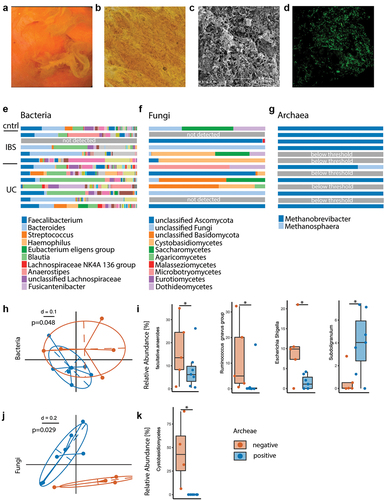
Figure 3. Exploratory analysis of polymicrobial mucosal biofilm composition differs depending on presence of archaea. (a) Example of endoscopic view of mucosal biofilm. (b) Biofilm flush specimen under light microscopy shows yellow color, bacteria and shed epithelial cells. (c) SEM analysis of biofilm flush shows a thick layer of bacterial biofilm and extracellular matrix. (d) FISH with general bacterial probe (green) of methacarn fixed biofilm flush sample. (e–g) Stacked bar plot of relative abundance data, bacteria (e), fungi (f) and archaea (g). (h–k) Comparison between archaea-pos (blue) and archaea-neg (orange) biofilm flush samples. (h) NMDS plot of generalized unifrac distances of bacterial composition. (i) Relative abundance of facultative anaerobes and bacterial genera. (j) NMDS plot of generalized unifrac distances of fungal composition. (k) Relative abundance of Cystobasidiomycetes. Statistical analysis: (e–k) n = 13 (1 cntrl, 5 IBS, 7 UC), (h, i) n = 7 archaea-pos, 5 archaea-neg. (k) n = 6 archaea-pos, 4 archaea-neg. (h) PERMANOVA of the distance matrices, (i,k) Kruskal-Wallis rank sum test. (j) Mann Whitney U test, n = 9 archaea-high, 16 archaea-low, *p ≤ .05.
Supplemental Material
Download Zip (498.7 KB)Data availability statement
16S rRNA gene amplicon sequencing data was deposited under the BioProject accession number PRJNA644520 (cohort 1) and PRJNA1100194 (cohort 2). Metadata for all samples, custom code and input tables can be accessed at github: github.com/MaximilianBaumgartner/biofilm_archaea.