
Figures & data
Figure 1. PS128 rescues behavioral abnormalities of the VPA mice.
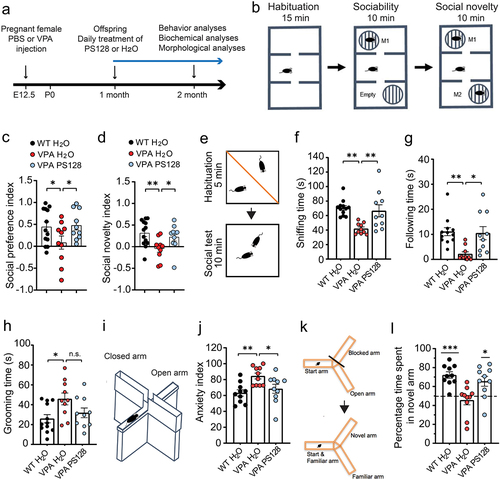
Figure 2. PS128 restores dendritic morphology of VPA mice.
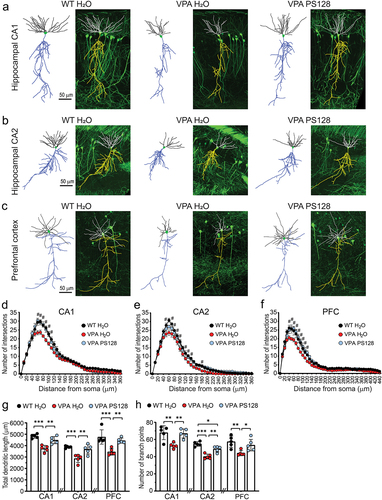
Figure 3. PS128 rescues spine loss in VPA mice.
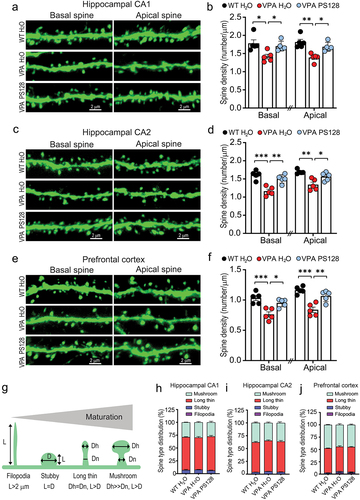
Figure 4. PS128 restores reduced kinase activities and synaptic glutamate receptors in the hippocampus of VPA mice.
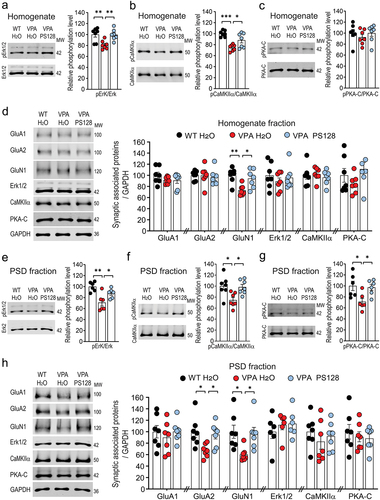
Figure 5. PS128 restores oxytocin expression in the PVN of VPA mice.
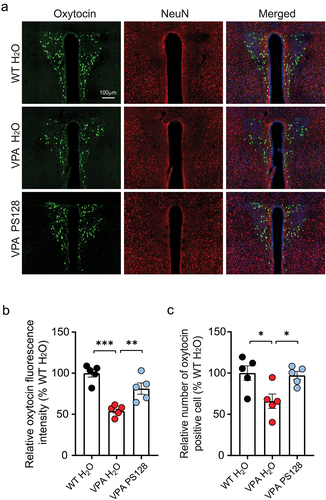
Figure 6. PS128 loses ability to rescue VPA-induced behaviors in mice lacking oxytocin receptors.
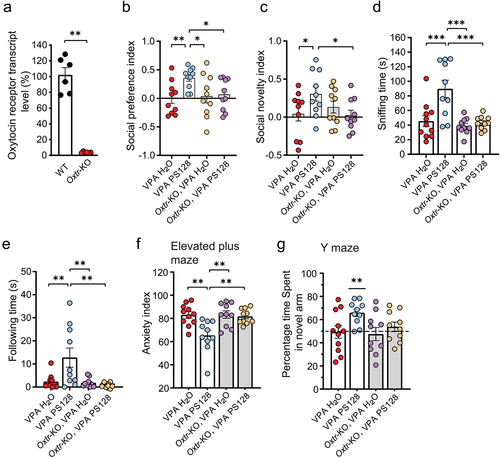
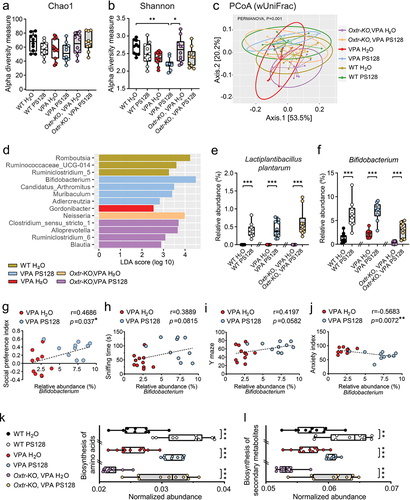
Figure 7. PS128 increases Bifidobacterium abundance in the gut, which correlates with improvements in ASD-associated behaviors in VPA mice.
Supplemental Material
Download Zip (120.1 MB)Data availability statement
The data supporting the findings of this study are available within the article and its supplementary materials. The raw sequencing data for all 61 samples are deposited on Figshare https://figshare.com/s/6e1b71b946d8f74a7505.