
Figures & data
Figure 1. Tn-seq analysis for identification of functional genes under anaerobic conditions in E. faecium.
(a) Schematic depiction of Tn-seq data. (b) In the control group, transposon insertion sites and insertion numbers at different sites and the presence of transposon insertions in 2702 genes within the E980 genome of E. faecium are indicated by blue lines. (c) Identification of functional genes implicated in resistance to anaerobic conditions through Tn-seq analysis. Distinct bubbles denote distinct genes, with bubble sizes corresponding to fold changes. Fold changes increase as the size of the bubble increases. The x-axis represents genomic position of genes on the chromosome, while y-axis represents outcome of statistical analysis of Tn-seq data. Genes exhibiting a significant change (BH < .05) in growth between anaerobic treatment and aerobic treatment groups are grouped by function and are labeled with different colors, and name and change in abundance between the control conditions and growth in anaerobic treatment group are indicated next to the bubbles in parentheses, while remaining genes are represented in gray.
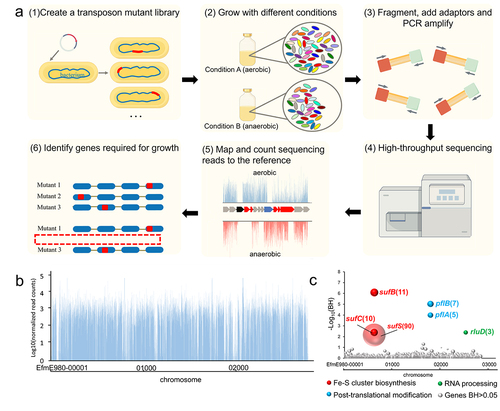
Figure 2. Essential gene of GO (a) and KEGG (b) enrichment analysis.
The enriched biological pathways are shown on the y-axis, and Gene Ratio was defined as the ratio of the number of DEGs annotated to GO term or on KEGG pathway to the total number of genes on the x-axis.
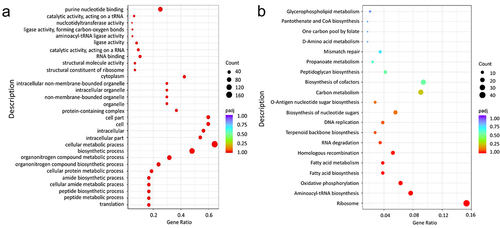
Figure 3. Phylogenetic and in silico analysis of Suf pathway.
(a) Phylogenetic analysis of suf gene cluster of E. faecium E980. The sufA, sufB, sufC, sufD, sufS, and sufU genes are color-coded to reflect their homology in different organisms. (b). Illustrations of Suf pathway for Fe-S cluster biogenesis in bacteria. Solid arrows denote functional steps that are amply corroborated by in vitro and in vivo data. The dashed arrows represent steps that have yet to be comprehensively characterized. The depicted surface representation structures include SufB (red), SufC (gray), SufD (blue), the SufS homodimer (green), and SufU (yellow). The putative Fe-S cluster binding sites of SufB (c) and PflA (d) in E. faecium. The specific residues needed to ligate Fe-S cluster are illustrated as sticks. (e) In silico analysis of Fe-S cluster-containing proteins in E. faecium E980 (This image was created in part By Figuredraw). Growth curves of E. faecium under both aerobic and anaerobic conditions. Growth curves of WT (black, solid line), ΔsufB::gm (red, dotted line), and ΔsufB::gm + sufB (red solid line) under both aerobic (f) and anaerobic (g) conditions. Similarly, growth curves of WT (black, solid line), ΔpflA::gm (blue, dotted line), and ΔpflA::gm + pflA (blue solid line) under both aerobic (h) and anaerobic (i) conditions were generated. The growth curves represent the average data from three independent experiments. Asterisks indicate significant differences between WT and mutant strains according to Student’s t test: *** P ≤ .001, ** P < .05.
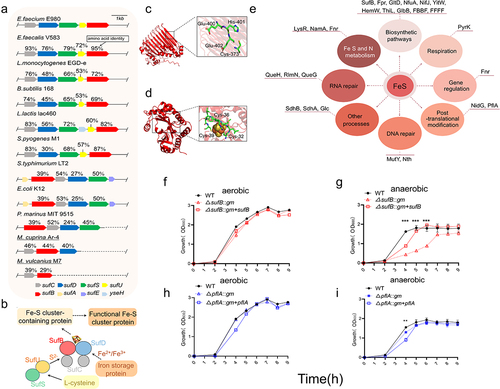
Figure 4. Transcriptome comparison between WT and sufB mutant strains under anaerobic conditions.
(a) Bubble plot of the DEGs (WT vs ΔsufB::gm). The dashed line indicates that P-value is equal to .05. The highly down-regulated and carbohydrate-related genes were labeled, in which the corresponding sugars are indicated in parentheses; q1-q6 represent the genes that were used for qPCR validation (Figure S6). (b) The top 20 enriched GO terms of the DEGs. (c) Bacterial strains (WT, ΔsufB::gm and ΔsufB::gm + sufB) were tested for their ability to metabolize 17 different sugars under aerobic and anaerobic conditions. The color gray and dark yellow represent negative and positive results for sugar metabolism, respectively. The light yellow represents intermediate result. The periods of metabolic gap between mutant and WT are marked in green boxes.
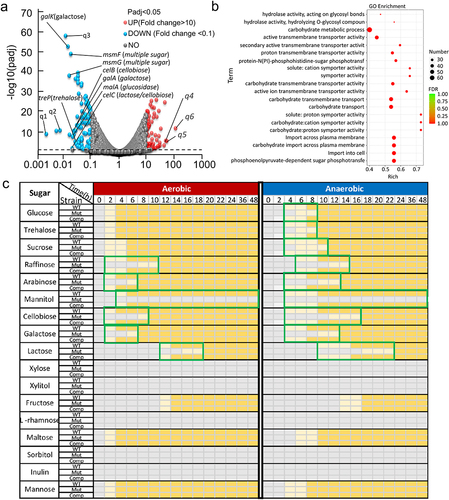
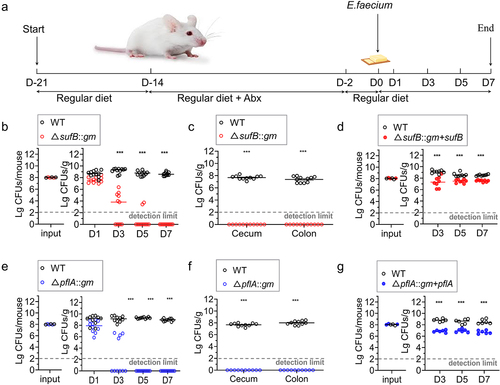
Figure 5. Colonization of intestine by E. faecium in a mouse model.
(a) Flow chart of animal experiments. Ten mice were inoculated with pure cultures in competition experiments with 1:1 mixtures of sufB mutant and WT. Samples of feces were collected on Days 1, 3, 5, and 7 after colonization, and samples of the cecum and colon were collected on Day 7 of colonization. (b) and (c), The numbers of E. faecium in feces, cecum, and colon of WT and ΔsufB::gm strains were determined. respectively. The other mutant, ΔpflA::gm, underwent the same treatment (e) and (f). Mice were inoculated with pure cultures in competition experiments with 1:1 mixtures of ΔsufB::gm + sufB and WT. Samples of feces were collected on Days 3, 5, and 7 after colonization. (d) The numbers of E. faecium in feces of WT and ΔsufB::gm + sufB strains were determined. respectively. The other strain, ΔpflA::gm + pflA, underwent the same treatment. (g) The data are presented in the form of a scatter plot, displaying the median. The P values obtained through paired 2-tailed Student’s t tests are indicated for the comparisons between WT and mutant strains. CFU is an abbreviation for colony-forming units. ***P < .001. n = 10 in each group.
Supplemental material
Supplemental Material
Download Zip (11.3 MB)Data availability statement
The datasets generated during this study are available in the National Center for Biotechnology Information (NCBI) BioProject Repository https://www.ncbi.nlm.nih.gov/bioproject under BioProject PRJNA1061835.