
Figures & data
Figure 1. Gut microbiota dysbiosis in NTM-LD patients.
Feces of healthy controls (HC) and patients with nontuberculous mycobacterial lung diseases (NTM-LD) were collected, followed by DNA extraction, sequencing, and bioinformatics analysis. Alpha diversity is represented by Shannon and Chao1 index (a) and beta diversity is represented by unweighted, weighted unifrac (b) and PCoA (c) between the two groups. Significantly different bacterial genera between the two groups by using Welch’s t-test (d). Spearman’s correlation analysis between the 11 identified bacterial genera and NTM-LD disease severity (e). P-values were corrected for multiple comparisons by using Benjamini and Hochberg method. (*adjusted-P < 0.05; **adjusted-P < .01; ***adjusted-P < .001).
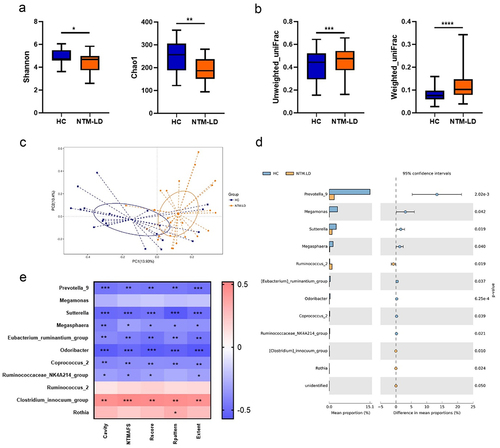
Figure 2. P. copri predominantly induce TLR2 pathway and NTM-LD patients had compromised TLR2 activation activity.
The relative abundance of Prevotella_9 genus in healthy controls (HC) and patients with NTM lung diseases (NTM-LD) of 16S sequencing data (a). The relative abundance of P. copri was validated in a second cohort by qPCR (b). THP-1 derived macrophage cells were treated with heat-killed P. copri at the indicated multiplicity of infection (MOI) with or without a TLR2 (50-μM C29) or TLR4 (1-μM TAK-242) inhibitor. The amount of TNF-α in the culture supernatant was detected by ELISA (c). HEK-blue-mTLR2 and HEK-blue-mTLR4 reporter cells were treated with heat-killed P. copri at the indicated MOI. The activities indicated by NF-kB activation were measured as absorbance at 630-nm wavelength (d). TLR2 ligands (TLR2Ls) in stool supernatant and plasma between two groups were detected by using HEK-blue-mTLR2 reporter cells. The activities indicated by NF-kB activation were measured as absorbance at 630-nm wavelength (e, f). Data are presented as the mean ± standard deviation (SD). *P < .05; **P < .01; ***P < .001; NS, not significant (unpaired Student’s t-test).
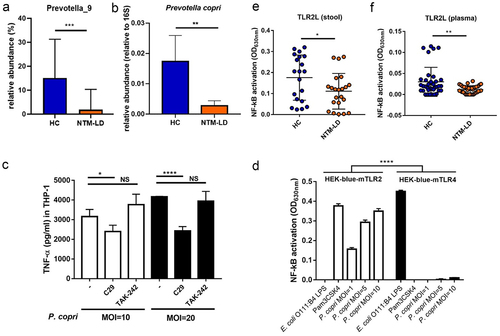
Figure 3. Gut microbiota dysbiosis and compromised TLR2 activation activity in mice receiving four antibiotics.
Feces of mice treated with drinking water (CTL) and drinking water with antibiotics (ABX) were collected, and DNA extraction, sequencing, and bioinformatics analysis were performed. The abundance of microbiota was determined by qPCR using 16S V3/V4 primers between two groups (a). Alpha diversity is represented by Chao1, ACE, and observed species (b) and beta diversity is represented by PCoA (c) between two groups. The relative abundance of P. copri between two groups was examined by qPCR (d). TLR2 ligands (TLR2Ls) in stool supernatant, serum, and lung supernatant between two groups were detected by using HEK-blue-mTLR2 reporter cells. The activities indicated by NF-kB activation were measured as absorbance at 630-nm wavelength (E, F, g). The expression of TLR2 in colon and lung tissues were determined by RT-qPCR (H, I) and ELISA methods (J,K). Data were presented as the mean ± standard deviation. *P < .05; **P < .01; ***P < .001; ****P < .0001 (unpaired Student’s t-test).
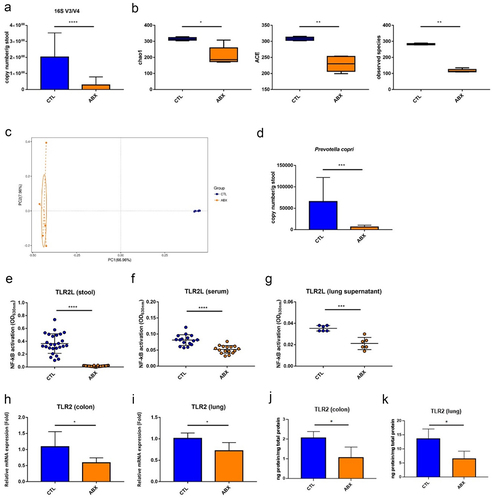
Figure 4. Transcriptomic analysis of lung tissues of ABX mice.
Schedule of animal experiment (a). The lung tissues of mice treated with drinking water (CTL) or drinking water with antibiotics (ABX) for 3 weeks were collected at 2 days after antibiotic treatment cessation and then subjected to transcriptomic analysis. Bar plots of the significantly upregulated and downregulated genes from GO enrichment analysis of lung tissues of ABX mice as compared to CTL mice (top 10 gene sets in GO_BP, GO_MF, and GO_CC) are shown in (b) and (c), respectively. Three genes (Gbp2, Gzmb, and CCR6) were validated by quantitative RT-PCR (d – f). Data were presented as the mean ± standard deviation (SD). *P < .05; **P < .01; ***P < .001 (unpaired Student’s t-test).
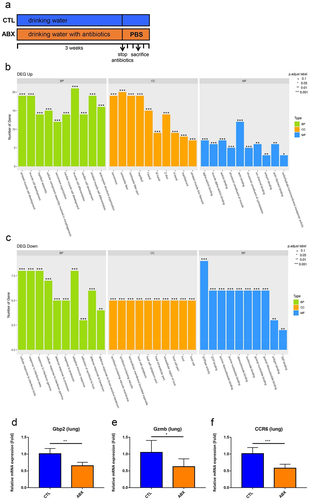
Figure 5. Administration of TLR2 agonist or treatment of P. copri restored immune response and ameliorated NTM-LD.
Schedule of the animal experiment (a). Mice were treated with drinking water (CTL) or drinking water with antibiotics (ABX) for 3 weeks. ABX mice were orally inoculated with a TLR2 agonist (ABX + TLR2L, 100-μg purified LTA-SA) or 1.5 × 10⁹ CFUs of P. copri (ABX + PC) once daily from the cessation of antibiotics to the end of experiment. Intranasal infection of M. kansasii was performed 2 days after antibiotic treatment cessation, and mice were sacrificed after 48 hours. Mycobacterial proliferation in lung homogenates was determined by enumeration and results were expressed as CFUs per gram of organ (b). Histopathology of the lung tissues were shownd using hematoxylin and eosin stain (c). The infection foci showed histiocytic response and highlighted by black arrowhead. Differentially expressed genes among these four mice groups are shown in the heatmap (d). The GO enrichment of genes highly expressed in ABX mice (left panel, labeled in yellow) and those induced by the administration of TLR2L and PC (right panel, in blue) are shown in (e) and (f), respectively. Data are presented as mean ± standard deviation (SD). *P < .05; **P < .01 (one-way ANOVA with post hoc Dunnett’s multiple comparison).
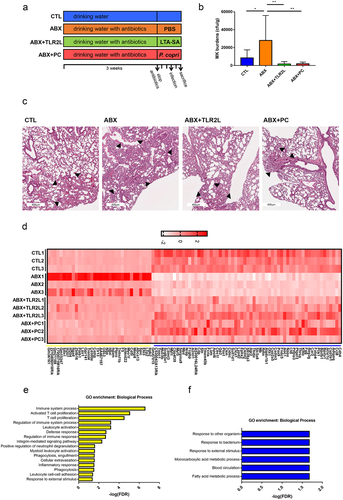
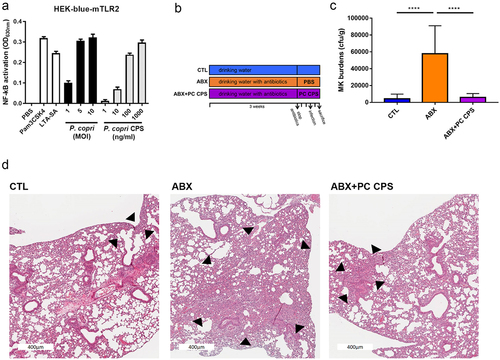
Figure 6. Administration of capsular polysaccharide of P. copri ameliorated NTM-LD.
HEK-blue-mTLR2 reporter cells were treated with heat-killed P. copri at the indicated MOI or purified capsular polysaccharides (CPS) of P. copri at the indicated concentration. The activities indicated by NF-kB activation were measured as absorbance at 630-nm wavelength (a). Schedule of animal experiment (b). Mice were treated with drinking water (CTL) or drinking water with antibiotics (ABX) for 3 weeks. ABX mice were orally inoculated with PC CPS (ABX + PC CPS, 100-g purified PC CPS) once daily from the cessation of antibiotics to the end of the experiment. Intranasal infection of M. kansasii was performed 2 days after antibiotic treatment cessation, and mice were sacrificed after 48 hours. Mycobacterial proliferation in lung homogenates was determined by enumeration and results were expressed as CFUs per gram of organ (c). Histopathology in lung tissues (d). The infection foci showed histiocytic response and highlighted by black arrowhead. Data are presented as the mean ± standard deviation (SD). ***P < .001 (one-way ANOVA with post hoc Dunnett’s multiple comparison).
Supplemental material