
Figures & data
Figure 1. Effects of DSS colitis on deep vascular, shallow vascular, and luminal oxygen levels quantified by phosphorescence quenching oximetry. (a) Schematic diagram of deep tissue oxygen sampling using Oxyphor PdG4 probe throughout the entire thickness of the cecum. (b) Vascular oxygen levels in control and DSS-treated mice under both ambient air and 100% oxygen inspiration as measured using Oxyphor PdG4. (c) New two-color phosphorometry allows for simultaneous quantification of shallow vascular (Oxyphor PtR4) and intraluminal oxygen levels (Oxyphor Micro). (d) Shallow vascular and luminal oxygen levels in control and DSS treated mice breathing ambient air and 100% O2. *FDR corrected p < .05 by unpaired or paired Student’s t-tests with two-stage step-up correction for multiple comparisons.
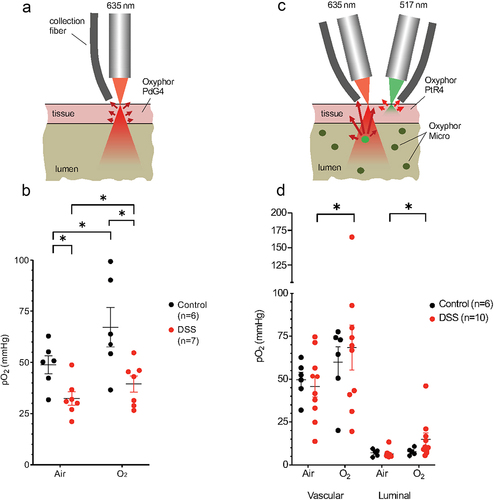
Figure 2. Effect of DSS colitis on the composition of the cecal microbiome. Alpha diversity assessed by (a) richness and (b) Shannon Index (p < .05 for both, two-tailed unpaired Student’s t-tests). Beta diversity assessed by (c) Bray-Curtis and (d) Jaccard distances (p = .01 for both, PERMANOVA). (e) Heatmap showing relative abundance of bacterial species in the cecum of control and DSS treated mice. (f) Differentially abundant taxa between the control and DSS groups (FDR <0.05, mixed effects modeling).
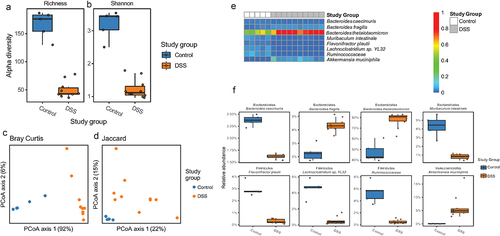
Figure 3. Effect of DSS colitis on the metagenome of the cecal microbiome. PCA plots showing (a) Bray-Curtis and (b) Jaccard distances for the metagenomes of control and DSS-treated mice. (c) Fold change in 28 glycoside hydrolase genes with nonzero counts in at least 90% of samples that were significantly altered with DSS colitis (FDR <0.10). Positive values indicated an increased abundance in the DSS group. Red asterisks indicate genes that are involved in mucin degradation. Glycoside hydrolase genes with multiple colors can act on multiple categories of glycans.
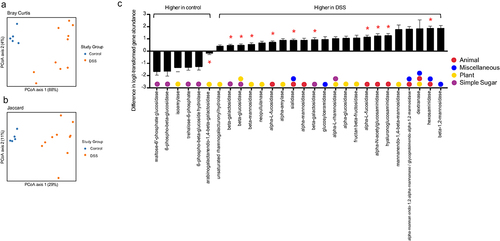
Figure 4. Compositional alteration of a human gut microbiome community in response to oxygenation in vitro. Alpha diversity assessed by (a) richness and (b) Shannon diversity (p < .05 for both, two-tailed Student’s t-tests). PCA plots of beta diversity shown as (c) Bray-Curtis and (d) Jaccard distances (p = .1 for both, PERMANOVA). (e) Heatmap showing relative abundance of genera showing alterations in the microbial community under anaerobic and oxygenated conditions. (f) Differentially abundant taxa between anaerobic and oxygenated conditions (FDR <0.05, linear models of logistic transformed abundances).
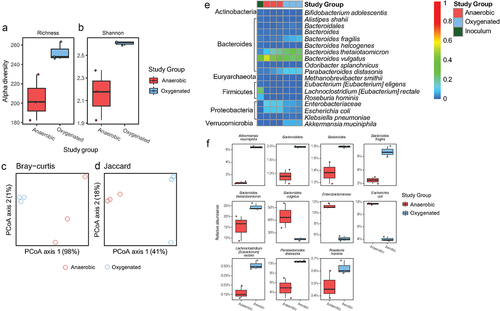
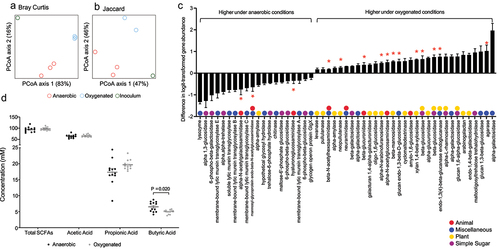
Figure 5. Alteration of a human gut microbiome metagenome and metabolome in response to oxygenation in vitro. PCA plots showing (a) Bray-Curtis and (b) Jaccard distances for the metagenomes under anaerobic and oxygenated conditions. (b) Fold change in 51 glycoside hydrolase genes with nonzero counts in at least 90% of samples that were significantly altered under oxygenated conditions (FDR <0.10). Positive values indicated an increased abundance in under oxygenated conditions. Glycoside hydrolase genes with multiple colors can act on multiple categories of glycans. *Glycoside hydrolases involved in mucin degradation. (d) Short chain fatty acid levels in reactor effluent under anaerobic and oxygenated conditions.
Supplemental Material
Download Zip (5.2 MB)Data availability statement
Shallow shotgun sequencing data is available via the Sequence Read Archive (SRA) under submission SUB13752278 and BioProject PRJNA1009084.