Figures & data
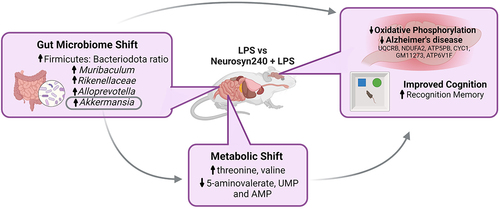
Figure 1. Body weight in response to LPS and Neurosyn240 treatments. a) There was no significant weight difference across groups throughout the 8-week experimentation, b) Total body weight gain did not significantly differ across groups. Data are represented as the mean ± standard error of the mean (s.e.m.). n = 10 mice per group. ns, not significant. LPS: Lipopolysaccharide.
Figure 2. Neurosyn240 improves LPS mediated reduction in cognitive performance a) nor performance significantly dropped in response to LPS treatment but was subsequently restored through Neurosyn240 supplementation. b) Although not significant, of time in center appeared to drop in response to LPS and was partially recovered by Neurosyn240 supplementation. c) Similar to OF, Y maze performance although not significant appeared to be reduced by LPS treatment with slight recovery observed through Neurosyn240 supplementation. Data are represented as the mean ± standard error of the mean (s.e.m.). n = 10 mice per group. *p < p < 0.05, **p < 0.01. ns: not significant. OF: Open field; NOR: Novel object recognition; LPS: Lipopolysaccharide.
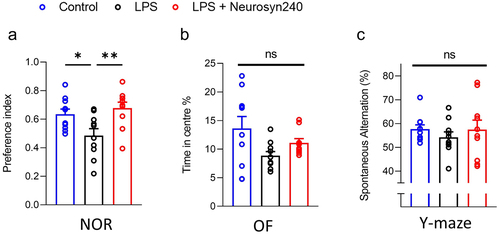
Figure 3. Neurosyn240 alters gut microbial profile which may influence nor performance a) Relative abundance of microbiota at the phylum (left) and class (right) levels in the indicated groups. b) Alpha diversity as analyzed using chao1 was significantly increased through Neurosyn240 treatment, c) but no significant difference was established using Shannon diversity index. d) PCA of beta diversity measured through Bray-Curtis analysis was significantly different across experimental groups. e) the Firmicutes to Bacteroidota ratio was significantly altered in response to LPS insult but was subsequently restored through Neurosyn240 treatment. f) at the genus level the Neurosyn240 intervention resulted in an increased in Akkermansia g) the abundance of Akkermansia correlated with nor performance. Data are represented as the mean ± standard error of the mean (s.e.m.). (n = 6 per group). *p < 0.05, **p < 0.01 ns: not significant.
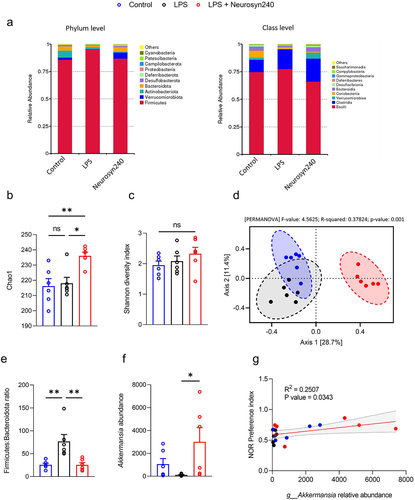
Figure 4. The gut metabolomic profile is altered by LPS and premix treatment a) PLS-DA plot showed separation of groups indicative of a metabolomic shift in response to treatment. (n ≥ 5); b) Volcano plot depicting the 19 significantly altered metabolites (FDR q < 0.05). c) Correlation analysis between metabolomics data and microbiome data conducted using M2IA. *p < 0.05, **p < 0.01.
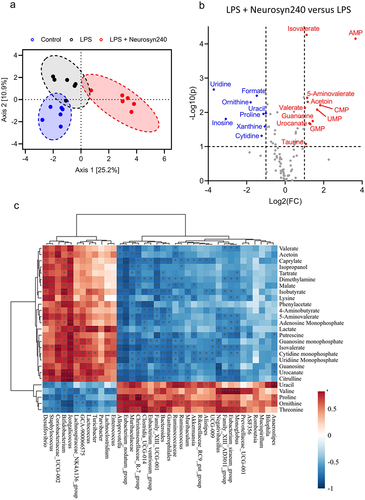
Table 1. The gut metabolomic profile associated with LPS and premix treatment correlates with nor performance and Akkermansia abundance. Metabolites in red highlight metabolites significantly associated with both nor performance and Akkermansia abundance. p-Adjusted values provided using Benjamini-Hochberg FDR correction.
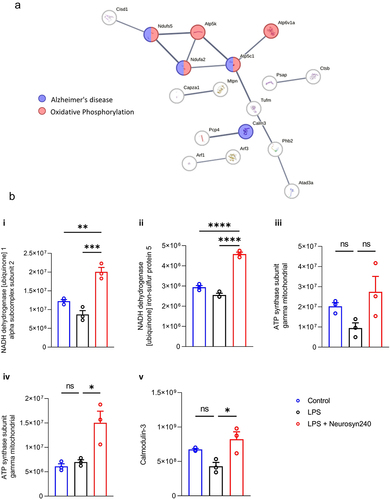
Figure 5. Brain proteomic profile is altered by LPS and Neurosyn240 treatment a) Protein–protein interaction analysis using STRING highlight Alzheimer’s disease, Oxidative phosphorylation, metabolic pathways and retrograde endocannabinoid signaling as highly altered pathways; b) Subsequent heatmap depicting the highlighted proteins associate with these pathways; c) Cluster of proteins that are reduced by LPS and recovered by Neurosyn240 are highly related to oxidative phosphorylation.
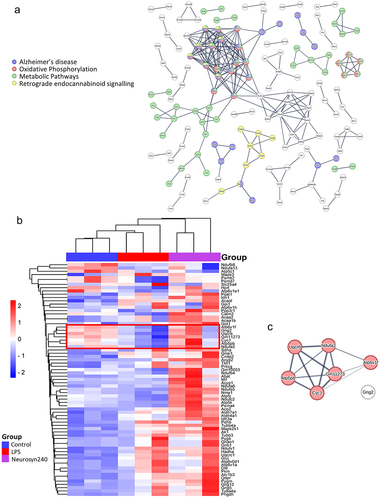
Figure 6. Brain proteomic profile partially correlates with Akkermansia abundance. a) Protein–protein interaction analysis using STRING highlight Alzheimer’s disease and oxidative phosphorylation as being the most activated. b) Abundance of these key proteins.