
Figures & data
Table 1. Real-time PCR Primers.
Figure 1. TDP43 mutant mice have less body weight, decreased rotarod test time, slowed intestinal mobility, and altered enteric neuromuscular structure, compared with the age-matched WT mice.
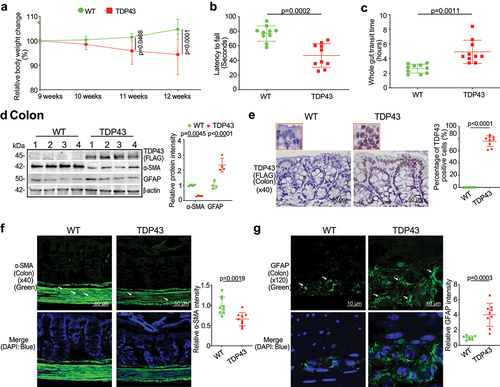
Figure 2. Augmented intestinal permeability and altered tight junctions (TJ) in the intestine, and spinal cord of the TDP43 mice compared with the age-matched WT mice.
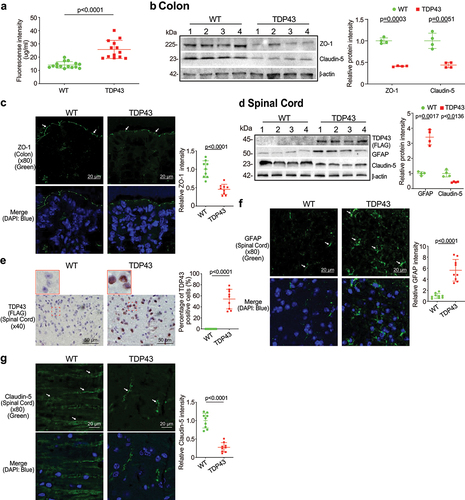
Figure 3. Increased human mutant TDP43 and GFAP protein expression while decreased ZO-1 and Claudin-5 protein expression in the brains of TDP43 mutant mice compared with the age-matched WT mice.
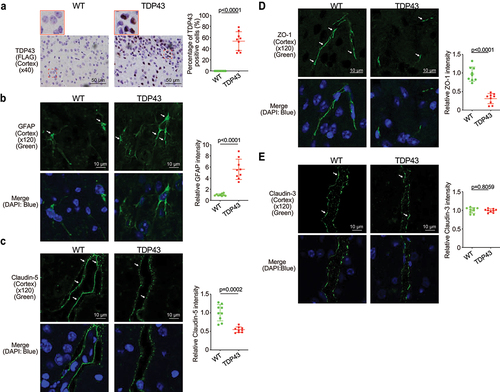
Figure 4. Butyrate treatment led to enhanced ENS and muscle function in the colon, reduced hmTDP43 mutant and GFAP protein expression, increased TJs proteins expression in the colon, spinal cord, and brain of TDP43 mutant mice.
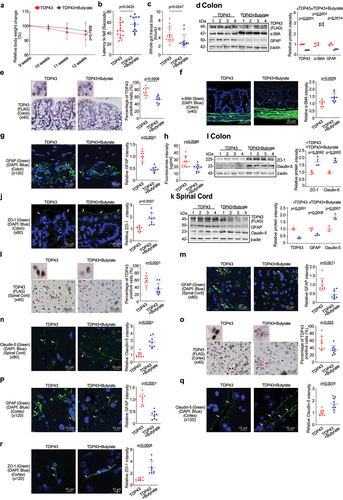
Figure 5. Probiotics treatment led to enhanced ENS and muscle function in the intestines, reduced hmTDP43 and GFAP protein expression, increased TJs proteins expression in the intestine, spinal cord, and brain of TDP43 mutant mice.
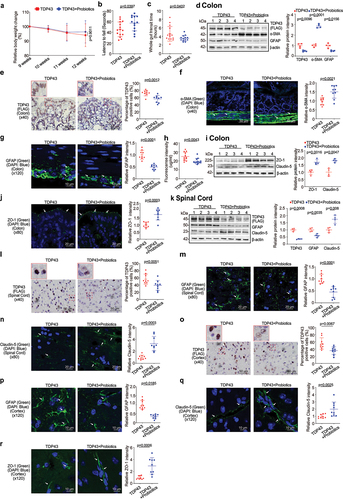
Figure 6. Butyrate or VSL#3 treatment corrected dysbiosis in ALS TDP43 mice, modulating microbiome leads reduced LPS expression in ALS TDP43 mice.
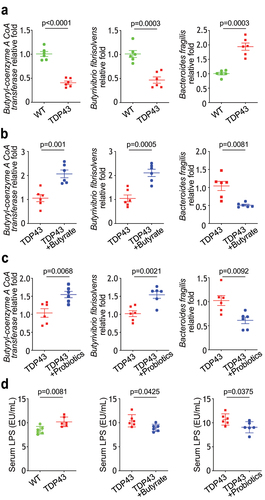
Figure 7. Butyrate or probiotic VSL#3 treatment reduced serum IL-6, IL-17, and IFN-γ expression in TDP43 mice.
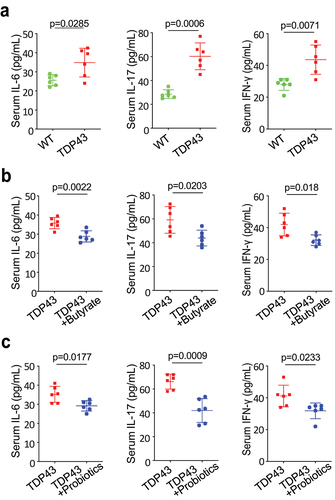
Figure 8. Butyrate or probiotics treatment decreased aggregation of hmTDP43 protein, decreased GFAP and IBA1 expression in EGCs isolated from TDP43 mutant mice.
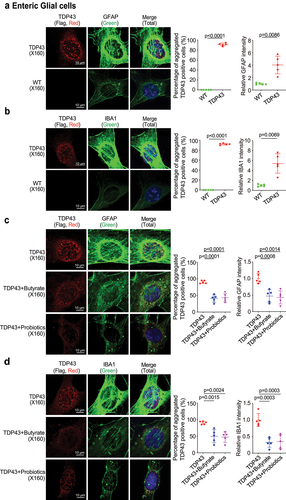
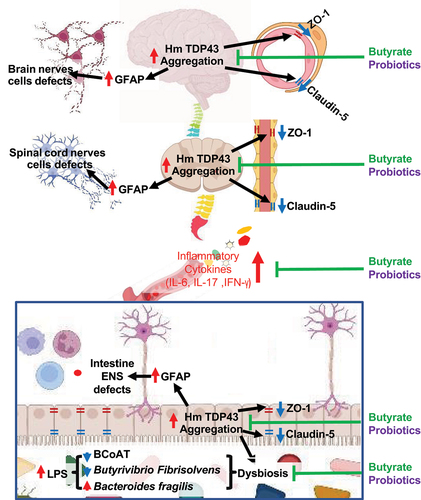
Figure 9. A working model of modulating microbiome in TDP43 mutant mice through the gut-microbiome-brain axis.
Data availability statement
The data that support the findings of this study are available from the corresponding author, J.S., upon reasonable request.