
Figures & data
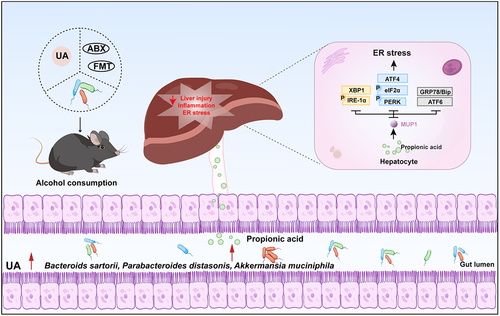
Figure 1. The effect of UA on chronic alcohol-induced liver injury.
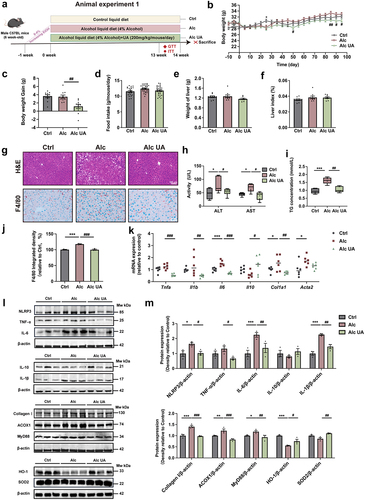
Figure 2. UA alleviates alcohol-induced hepatic endoplasmic reticulum stress via upregulating MUP1.
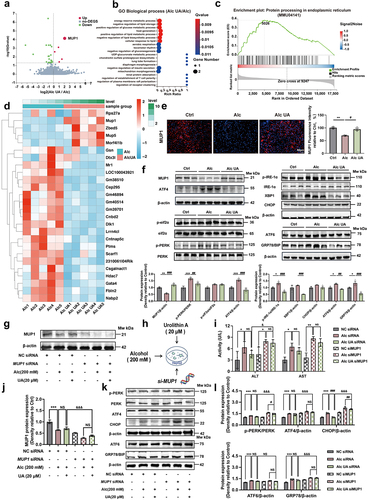
Figure 3. UA restores alcohol-induced intestinal barrier damage and gut microbiome dysbiosis.
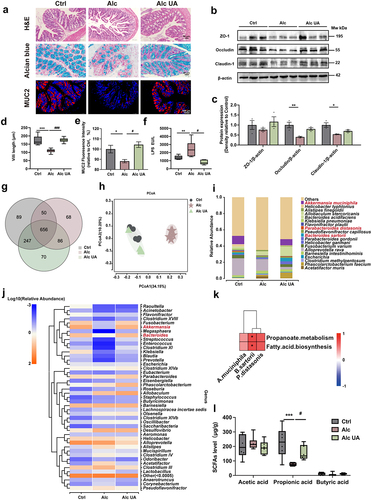
Figure 4. UA alleviates ALD in a gut microbiota-dependent manner.
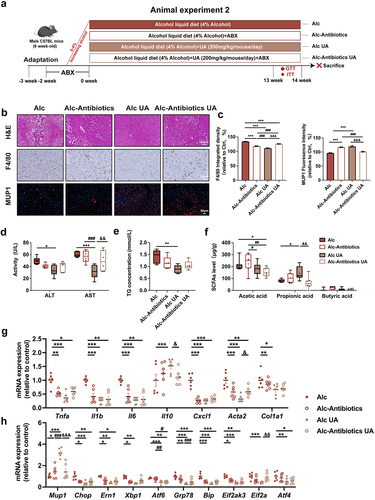
Figure 5. Gut microbiota mediates the activation of MUP1 to alleviate ALD.
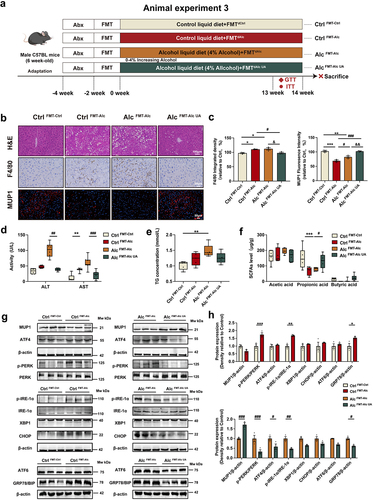
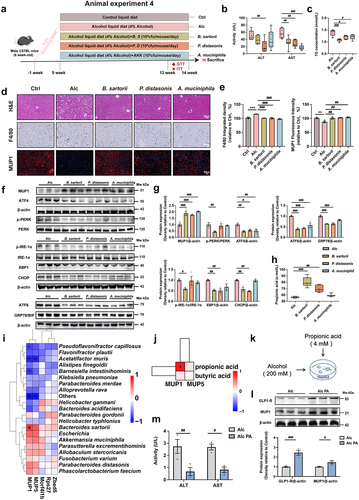
Figure 6. B. sartorii, P. distasonis, A. muciniphila, and their derived propionic acid mediate the activation of hepatic MUP1 in ALD.
Supplementary Material clean.docx
Download MS Word (4.8 MB)Data availability statement
The raw data of RNA sequencing in the current study were deposited on GEO, and the accession number is GSE253307. The accession number for the entire 16S rRNA sequencing dataset reported in this manuscript is NCBI Bio Project: PRJNA1065023.
Original data have been deposited to Mendeley Data, the DOI number is 10.17632/84nnnpx8d8.2.