
Figures & data
Figure 1. Intratumoral microbiome landscape of gastric cancer (GC). (a) Summary of the clinical characteristics of 251 patients with GC. (b) Rarefaction curve of GC and noncancerous adjacent tissues (NAT). (c) α-diversity difference between GC and NAT. (d) Principal coordinate analysis (PCoA) of the microbiome data for GC and NAT. (e) Differences in microbiota abundances between GC and NAT. (f) α-Diversity differences and PCoA among dMMR, EBV and pMMR subtypes. (g) Microbiota abundance differences among dMMR, EBV and pMMR subtypes. (h) Correlations between genera (top 20) and EBV load. The size of the circle represents the magnitude of the Spearman correlation coefficient.
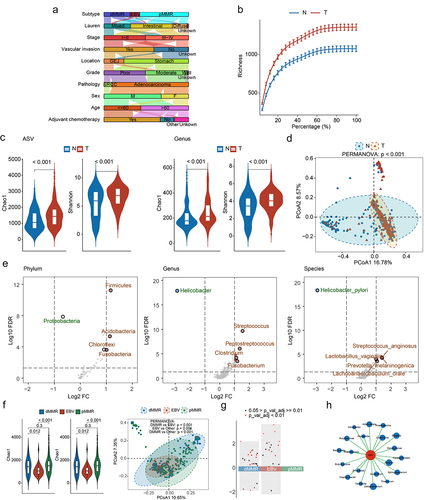
Figure 2. Taxa associated with overall survival (OS) and adjuvant chemotherapy (ACT) after adjusting for clinical features. (a) Phyla, genera, and species associated with OS, after adjusting for clinical features. (b) Phyla, genera, and species associated with ACT, after adjusting for clinical features.
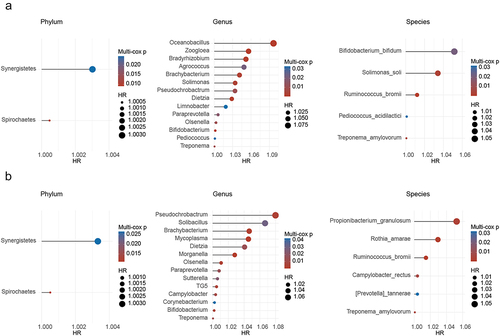
Figure 3. Msubtypes and their correlation with clinical gastric cancer (GC) outcomes. (a) Heatmap of differentially abundant genera (Adj p < 0.05, Log2 FC > 2, and AUC > 0.7) among the Msubtypes. (b) Kaplan-Meier curve for overall survival (OS) among the Msubtypes. (c) α-Diversity differences and PCoA among the Msubtypes. (d) Co-abundance patterns among the genera of the Msubtypes.
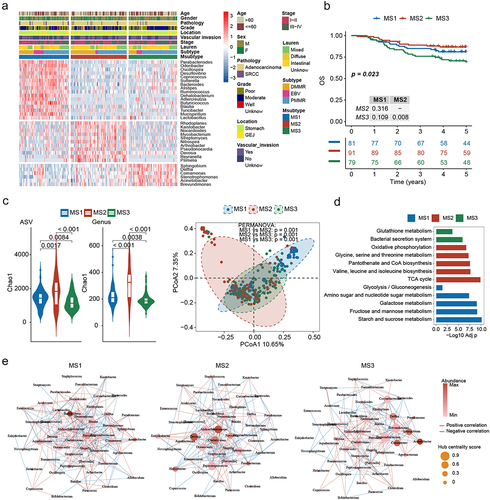
Figure 4. MS3 is associated with poor overall survival (OS), regression-free survival (RFS), and poor chemotherapy efficacy. (a) GSEA of enriched pathways at the transcriptome level among Msubtypes. (b) Differences in Helicobacter pylori abundances among Msubtypes. (c) Kaplan-Meier curves for OS among the Msubtypes based on patients from the five transcriptome cohorts. (d) Kaplan-Meier curves for OS among the Msubtypes based on patients with stage II III gastric cancer (GC) who received adjuvant chemotherapy (ACT), from the three transcriptome cohorts. (e) Differences in response to neoadjuvant chemotherapy (NAC) among the Msubtypes, based on the published PUCH cohort data.
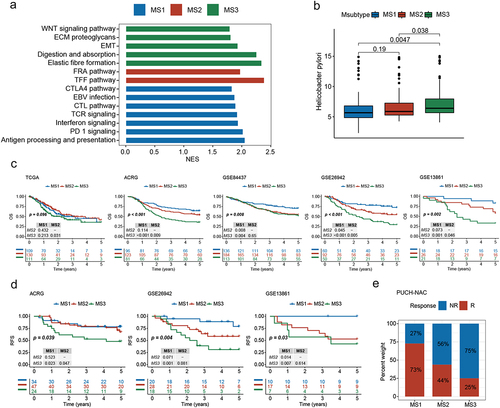
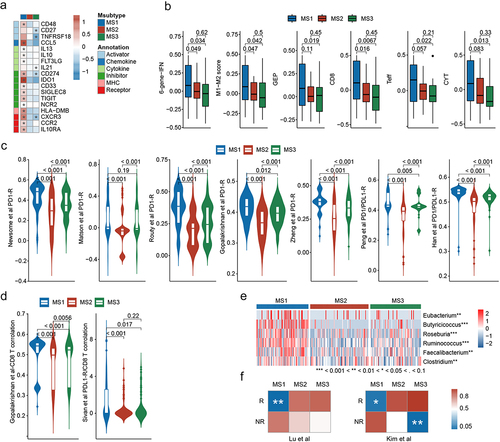
Figure 5. MS1 is associated with favorable immunotherapy efficacy. (a) Differences in the expression of immune genes among the Msubtypes. (b) Differences in immunotherapy-associated mRNA signatures among the Msubtypes. (c) Differences in immunotherapy-associated microbiota signatures among Msubtypes. (d) Differences in CD8+ T cell-associated microbiota signatures among the Msubtypes. (e) Heatmap of butyric acid-producing genera among the Msubtypes. (f) Submap analysis of the three Msubtypes between our cohort and the response (R) and non-response (NR) subgroups of two gastric cancer (GC) cohorts who received immunotherapy.
Supplemental Material
Download Zip (1.8 MB)Data availability statement
The sequencing data generated by this study is available through the Genome Sequence Archive for Human (GSA-Human): HRA005570 (16s rRNA, https://ngdc.cncb.ac.cn/gsa-human/submit/hra/subHRA007973/finishedOverview.) and HRA005478 (RNAseq, https://ngdc.cncb.ac.cn/gsa-human/submit/hra/subHRA007857/finishedOverview).