
Figures & data
Figure 1. The distribution and genetic organization of the yersiniabactin cluster among S. enterica subspecies and serovars. DNA sequence and gene organization of the yersiniabactin locus in S. Infantis pESI (accession number CP047882) was compared to its homologous regions in plasmid pSC-31-2 of S. Typhimurium var. 5 (accession number: CP028316), plasmid pCFSAN024415 of S. Newport (accession number: CP074336), plasmid pSA18578_2 of S. Minnesota (accession number: CP080515), unnamed plasmid of S. Macclesfield (accession number: CP022118), plasmid p3 of S. Heidelberg (accession number: CP031362), plasmid pCFSAN001016 of S. enterica subsp. salamae (accession number: CP074595), the chromosome of S. enterica subsp. diarizonae (accession number: CP023345), and the HPI region in Yersinia pestis strain SCPM-O-B-5942 (accession number: CP045258). Genetic comparison and graphical illustration of the yersiniabactin genes was prepared using the EasyFig tool (https://mjsull.Github.io/Easyfig/). The degree of sequence similarity was computed by BLAST and is shown by shades of gray. Yersiniabactin biosynthetic genes are colored in black, transport genes in red, regulatory gene in blue and genes with unknown function are illustrated in turquoise. The genes flanking the integration site of the ybt cluster are shown in yellow. Supplementary information indicating the degree of identity between the Salmonella Ybt proteins and their homologs in Y. pestis is provided in Table S3.
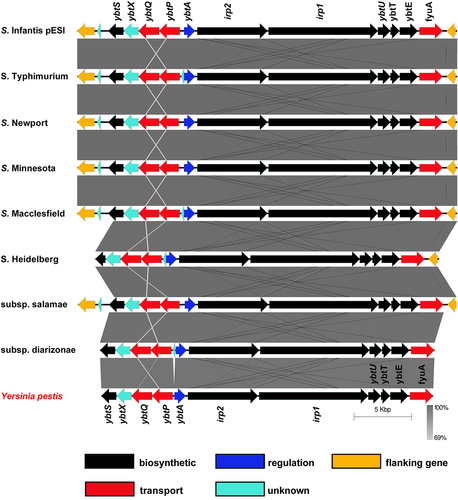
Figure 2. ybt genes are induced in S. Infantis pESI during the mid-late logarithmic phase and under iron-limiting conditions. (a) S. Infantis 119944 expressing the luxCDABE operon under the ybtA pESI promoter (ybtA::lux) was grown for overnight in selective LB medium at 37°C, washed and subcultured (1:30) into minimal M9 medium (blue line), M9 medium supplemented with 50 µM of the iron chelator 2,2-dipyridyl (DIP) (green line), and M9 supplemented with 100 µM FeCl3 (red line) in a 96-well microplate. The optical density of the culture at 600 nm (right Y-axis and broken lines) and the bioluminescence signal normalized to OD600, shown as relative light units (RLU; left Y-axis and continuous lines) were measured for 24 h using a Tecan plate reader set to 37°C with shaking. The chart shows the mean and standard deviation (SD) of six replicates in one (out of three) representative experiment. (b) The same experiment was conducted following subculture of S. Infantis 119944 strain carrying the ybtA::lux reporter construct in LB medium (blue line), LB supplemented with 50 (red line), or 200 (green line) µM DIP. The chart shows the mean and SD of three replicates in one (out of three) representative experiment. (C-F) The transcription of fyuA (c), irp2 (d), ybtA (e) and ybtP (f) was determined using qRT-PCR for S. Infantis 119944 cultures grown at 37°C to the late logarithmic phase (OD600 0.8–1) in M9 minimal medium or M9 supplemented with 400 µM DIP relative to their expression in LB broth. The fold change in expression is shown as the mean and standard error of the mean (SEM) of at least three biological repeats. One-way ANOVA was used to determine statistical significance between gene expression in LB and the expression in M9 or M9+DIP. Unpaired t-test was used to compare statistical significance between gene expression in M9 vs. M9+DIP. ns, not significant; *, p < 0.05; **, p < 0.01; ***, p < 0.005.
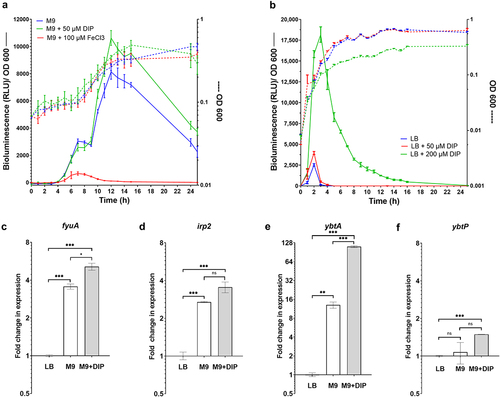
Figure 3. Ybt is not required for S. Infantis growth under iron limiting conditions. S. Infantis 119944 and its isogenic single null mutant strains irp2 (yersiniabactin), iroB (salmochelin), and entC (enterobactin); the double mutant strains iroB irp2 and iroB entC; and the triple mutant strain iroB entC irp2 were grown in LB to their stationary phase at 37°C under aerobic conditions. Subsequently, cultures were washed and subcultured into LB (a), M9 minimal medium (b), or M9 medium supplemented with 100 µM DIP (c). The growth of the strains at 37°C with shaking was determined along 20 h by optical density reading at 600 nm. (d) The growth curves of S. Infantis 119944, its isogenic entC null mutant strain and entC strains, expressing entC from a plasmid (pWSK29::entC) or harboring the empty vector (pWSK29) that were grown in M9 medium supplemented with 100 µM DIP as in (c) are plotted. The mean and SEM of 3–5 biological repeats is shown. One-way ANOVA was used to determine statistical significance. ***, p < 0.005.
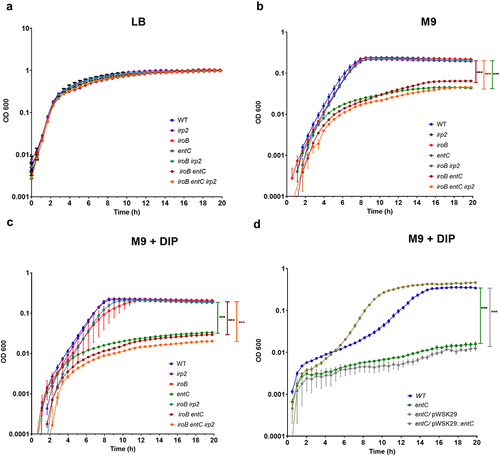
Figure 4. Yersiniabactin is induced in the presence of ROS and contributes to oxidative stress tolerance. (a) S. Infantis 119944, its isogenic irp2 null mutant, and a complemented irp2 mutant harboring pWSK29::irp2 or the empty vector (pWSK29) were grown in LB medium, subcultured into M9 medium and grown at 37°C with shaking until reaching OD600 of ~ 1. Hydrogen peroxide at a final concentration of 40 mM was added to the cultures, which were further incubated at 37°C. At 10 and 20 min post H2O2 challenging, serial dilutions were plated on LB agar plates to determine the number of viable CFUs relative to time 0. (b) S. Infantis 119944, its isogenic irp2 null mutant, and a complemented irp2 mutant harboring pWSK29::irp2 were subcultured in M9 supplemented with 100 µM FeCl3 and challenged with hydrogen peroxide as in (a). The number of viable CFUs relative to time 0, following 20 min of hydrogen peroxide (40 mM) challenge is shown. The graphs (a and b) show the mean of three biological repeats with SEM indicated by the error bars. One-way ANOVA was used to test statistical significance. (c-g) The transcription of fyuA (c), irp2 (d), ybtA (e), ybtP (f) and oxyR (g) that was used as a positive control was determined using qRT-PCR. S. Infantis 119944 cultures were grown at 37°C to the late logarithmic phase (OD600 0.8–1) in M9 minimal medium or in cultures that were grown in M9 and incubated with 4 or 20 mM hydrogen peroxide for 10 or 20 min. The fold change in expression following hydrogen peroxide exposure relative to expression in M9 is shown as the mean and SEM of three biological repeats. One-way ANOVA was used to determine statistical significance. ns, not significant; *, p < 0.05; **, p < 0.01; ***, p < 0.005.
Figure 5. Yersiniabactin gene expression is regulated by YbtA and Fur in S. Infantis pESI. (a) S. Infantis 119944, its isogenic ybtA null mutant strain, and the ybtA mutant expressing ybtA from a plasmid (pWSK::ybtA) were subcultured in M9 minimal medium and grown under aerobic conditions at 37°C. RNA that was extracted from late logarithmic phase grown cultures was subjected to qRT-PCR analysis. The relative expression of fyuA, irp2 and ybtP in the ybtA mutant and the complemented strain relative to their expression in the wildtype (WT) background is shown for three biological repeats. One-way ANOVA was used to determine statistical significance. (b-e) Total RNA was extracted from S. Infantis 119944 wildtype strain and ten isogenic mutants harboring null deletion in key regulatory genes of interest (fur, lrp, arcA, arcB, ompR, fnr, rpoS, phoP, soxRS and oxyR) that were grown in LB at 37°C to the late logarithmic phase. qRT-PCR was applied to define the fold change in fyuA (b), ybtA (c) irp2 (d), and ybtP (e) transcription between the wildtype background and each one of the mutant strains. (f) The expression of ybtA, ybtP, irp2, and fyuA was determined in a S. Infantis 119944 (WT), its isogenic fur mutant strain (fur) and in a fur mutant strain complemented with pACYC184::fur or the vector only (pACYC184) relative to their expression in the wildtype background using qRT-PCR. The charts show the mean and SEM of at least three biological repeats. One-way ANOVA was used to test statistical significance. ns, not significant; *, p < 0.05; ***, p < 0.005.
Figure 6. S. Infantis Fur binds directly to the ybtA promoter in pESI. (a) A pairwise comparison of the yersiniabactin cluster in S. Infantis pESI and Yersinia pestis was created using the EasyFig tool and is shown at the upper part of the panel. The grey area between the genetic scheme of pESI and Y. pestis represents the degree of sequence similarity and a 201-bp insertion element in the UTR of ybtA in pESI is shown as a white gap in the compared sequences. A histogram showing the GC skew of this region in pESI is shown at the top part of the panel. Multiple sequence alignment of the ybtA regulatory region in pESI, Y. pestis and Y. pseudotuberculosis is shown in the lower part of the panel. The sequence of the insertion element that is present in pESI, but absent in the Yersinia spp. is highlighted in grey. The Fur binding box is highlighted in yellow and the − 10 and − 35 promoter elements are indicated by open boxes. The cytosine, which was determined as the transcriptional start site of ybtA in pESI, by RACE is indicated by a capital C and colored in green. (b) The fur gene from S. Infantis 119944, was cloned into pET28a and introduced into E. coli BL21 (DE3). Polyhistidine-tagged Fur was induced and purified using a nickel column chromatography. Fractions from each stage of the purification process were separated on 15% polyacrylamide gel electrophoresis that was stained with coomassie blue and imaged. (c) A 378-bp DNA probe corresponding to the regulatory region of ybtA in pESI was amplified by PCR and subjected to an electrophoretic mobility shift assay (EMSA). DNA probe (150 ng) was incubated with increasing amounts of purified Fur-His tagged at room temperature and resolved on native 4% polyacrylamide gel. The free DNA probe and gel retardation of DNA-Fur complexes are indicated by arrowheads. (d) A 177-bp DNA probe corresponding to the regulatory region of ybtA from Y. Pseudotuberculosis was amplified by PCR and subjected to an EMSA as in (c). Both gels shown in (b) and (c) were run simultaneously in the same electrophoresis cell.
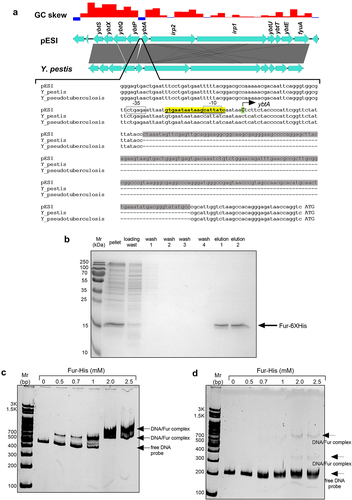
Figure 7. Yersiniabactin is dispensable for intramacrophage growth, but contributes to intestinal colonization of S. Infantis in mice. (a-b) Wildtype S. Typhimurium (STM), its ssaR isogenic mutant (ssaR), wildtype S. Infantis (SIN), and its isogenic irp2 mutant (irp2) were grown in LB broth to the stationary phase under aerobic conditions at 37°C and used to infect human macrophage U937 (a) and SWISS mice BMDMs (b) at MOI of 10, using the gentamicin protection assay. Intramacrophage replication is shown as the number (CFUs) of intracellular bacteria recovered at 24 h p.i., divided by the number of uptaken intracellular bacteria recovered at 2 h p.i.. Values represent mean and SEM of three independent infections. An unpaired two-tailed student-t test was used to determine statistical differences. (c) Ten female C57BL/6 mice were pretreated with streptomycin by oral gavage 24 h before they were intragastrically infected with 6 × 10⁶ CFU of a mixed (1:1) inoculum containing the wildtype S. Infantis 119944 (harboring pWSK129; KmR) and an irp2 null mutant strain (containing pWSK29; AmpR). Three days p.i., mice were euthanized and tissues were harvested aseptically, homogenized and plated onto selective XLD agar plates for bacterial enumeration. Each dot represents a competitive index (CI) value in one mouse in a single organ (cecum or colon). The CI was calculated as [mutant/wildtype] output/[mutant/wildtype] input. One Sample t-test against a theoretical value of 1 (which indicates equal fitness) was implemented to determine statistical significance. ns, not significant; ***, p < 0.005.
![Figure 7. Yersiniabactin is dispensable for intramacrophage growth, but contributes to intestinal colonization of S. Infantis in mice. (a-b) Wildtype S. Typhimurium (STM), its ssaR isogenic mutant (ssaR), wildtype S. Infantis (SIN), and its isogenic irp2 mutant (irp2) were grown in LB broth to the stationary phase under aerobic conditions at 37°C and used to infect human macrophage U937 (a) and SWISS mice BMDMs (b) at MOI of 10, using the gentamicin protection assay. Intramacrophage replication is shown as the number (CFUs) of intracellular bacteria recovered at 24 h p.i., divided by the number of uptaken intracellular bacteria recovered at 2 h p.i.. Values represent mean and SEM of three independent infections. An unpaired two-tailed student-t test was used to determine statistical differences. (c) Ten female C57BL/6 mice were pretreated with streptomycin by oral gavage 24 h before they were intragastrically infected with 6 × 10⁶ CFU of a mixed (1:1) inoculum containing the wildtype S. Infantis 119944 (harboring pWSK129; KmR) and an irp2 null mutant strain (containing pWSK29; AmpR). Three days p.i., mice were euthanized and tissues were harvested aseptically, homogenized and plated onto selective XLD agar plates for bacterial enumeration. Each dot represents a competitive index (CI) value in one mouse in a single organ (cecum or colon). The CI was calculated as [mutant/wildtype] output/[mutant/wildtype] input. One Sample t-test against a theoretical value of 1 (which indicates equal fitness) was implemented to determine statistical significance. ns, not significant; ***, p < 0.005.](/cms/asset/6e9ee978-ffea-492c-9272-27ba5ac53639/kgmi_a_2369339_f0007_b.gif)
Supplemental Material
Download Zip (2.3 MB)Data availability statement
The authors confirm that the data supporting the findings of this study are available within the article and its supplementary materials.