
Figures & data
Figure 1. Proanthocyanidins downregulate immune-related genes and affect immune cell hyperplasia in duodenum tissues of Heligmosomoides polygyrus-infected mice with no effect on worm burdens.
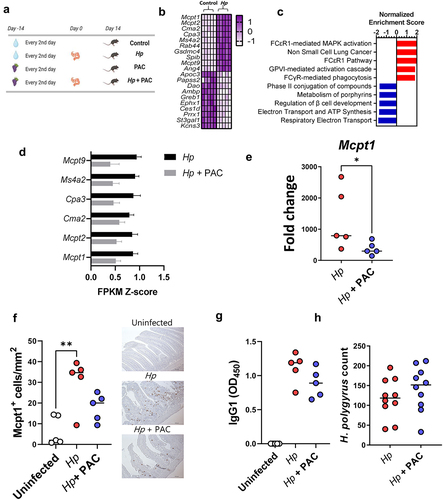
Figure 2. Proanthocyanidins modulate immune responses in Trichuris muris-infected mice.
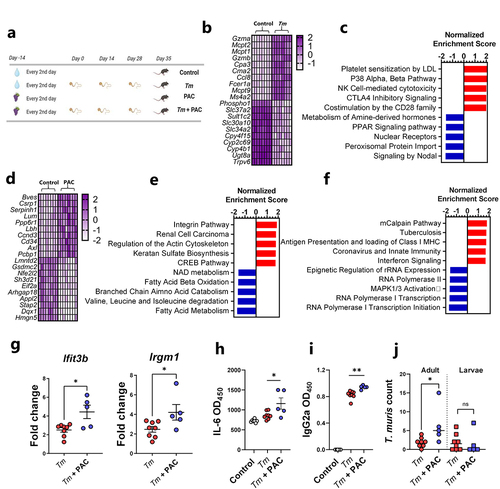
Figure 3. Proanthocyanidins alter T cell populations in the mesenteric lymph nodes in helminth-infected mice.
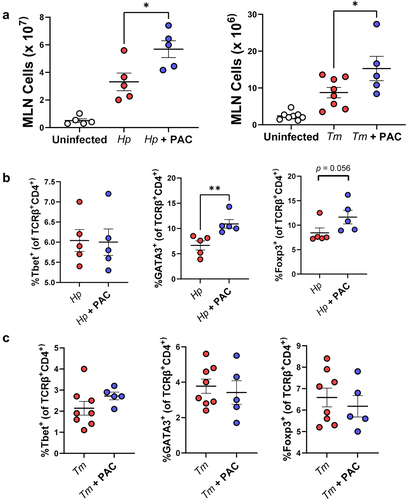
Figure 4. Effects of proanthocyanidins during Trichuris muris infection in mice fed either chow or semi-synthetic diets.
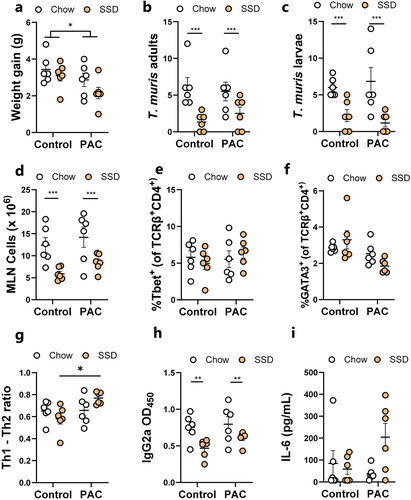
Figure 5. Impact of Heligmosomoides polygyrus (Hp) infection and proanthocyanidins (PAC) on the host cecal microbiota.
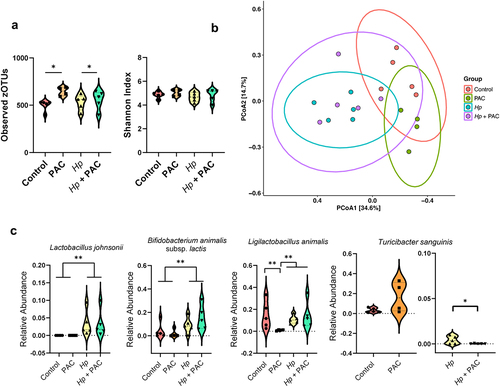
Figure 6. Impact of Trichuris muris (Tm) infection and proanthocyanidins (PAC) on the host fecal microbiota.
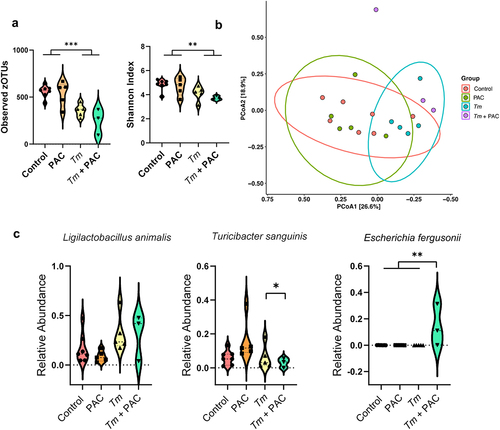
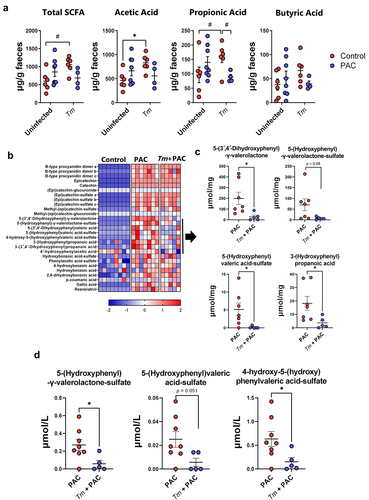
Figure 7. Short chain fatty acids and identification of proanthocyanidin metabolites in Trichuris muris infected mice.
Supplemental Material
Download Zip (9.5 MB)Data availability statement
RNA sequence data from cecum and duodenum are deposited at the NCBI Gene Expression Omnibus (GEO: Accession numbers GSE174756 and GSE176182). The raw 16S rRNA sequencing data can be accessed at Sequence Read Archive (https://www.ncbi.nlm.nih.gov/sra) using the accession number PRJNA1044063.