
Figures & data
Figure 1. The composition and function of the gut microbiota were altered in both MAFLD patients and mice. (a) PCoA comparing microbial beta diversity between healthy controls (HC, n = 21) and patients with MAFLD (n = 21). (b) Bar plot showing the relative abundances of the top 15 differential genera in human patients. (c-d) Functional prediction analysis plots based on FAPROTAX and BugBase. (e) PCoA of microbial beta diversity in healthy (HC), MAFLD-2W, and MAFLD-4W mice. (f) Bar plot showing the relative abundances of the top 15 differential genera in mice. n = 6 mice per group. MAFLD, metabolic-associated fatty liver disease; PCoA, principal coordinate analysis. *p < 0.05; **p < 0.01; ***p < 0.001.
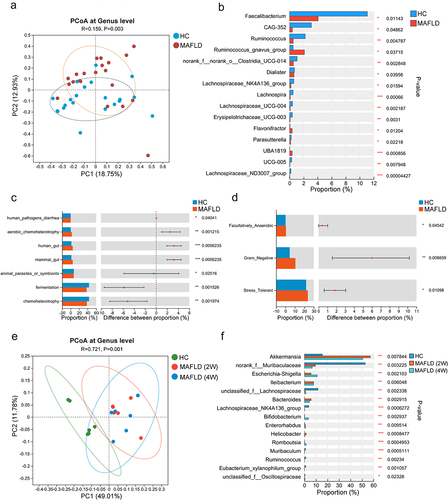
Figure 2. Administration of antibiotics or healthy microbiota significantly reduced hepatic fat accumulation in MAFLD mice (n = 5–6/group). (a) Study design involving MAFLD mice treated with antibiotics (Abx) or normal saline (NS). (b-d) Liver triglyceride and cholesterol levels, representative H&E staining of liver sections (magnification, ×100), and MAFLD activity score (NAS) in MAFLD mice treated with Abx or NS. (e) Study design involving MAFLD mice treated with MAFLD (control) or a healthy microbiota (WMT) (n = 8/group). (f-h) Levels of liver triglycerides and cholesterol, representative H&E staining of liver sections (magnification, ×100), and MAFLD activity score (NAS) in MAFLD mice treated with MAFLD or healthy microbiota. MAFLD, metabolic-associated fatty liver disease; MCD, methionine- and choline-deficient diet. *p < 0.05; **p < 0.01.
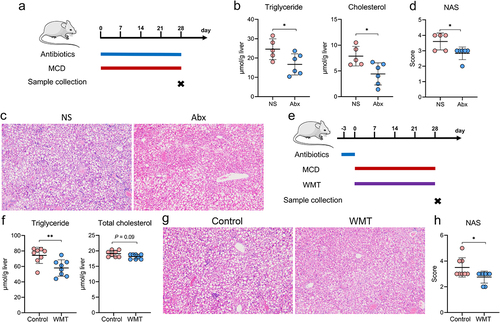
Figure 3. WMT significantly decreased liver fat accumulation in patients with MAFLD. (a) Study design for patients with MAFLD who received WMT. (b-d) Effects of WMT on fat attenuation parameters and blood triglyceride and cholesterol levels in patients with MAFLD. △MAFLD parameter = MAFLD parameter after treatment – MAFLD parameter at baseline. MAFLD, metabolic-associated fatty liver disease; WMT, washed microbiota transplantation. *p < 0.05; **p < 0.01.
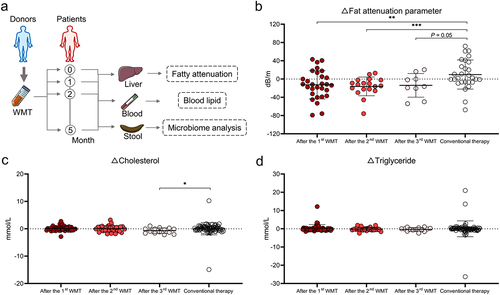
Figure 4. WMT altered the composition and function of gut microbiota in patients with MAFLD. (a) Box plots comparing the alpha diversity indices (Ace, Sobs, and Shannon) of the gut microbiota in patients with MAFLD before and after WMT. (b) PCoA plot illustrating microbial beta diversity among healthy donors and patients with MAFLD before and after WMT. (c) Heatmap depicting the correlations between genus-level abundance and levels of liver functional and blood lipid parameters in patients with MAFLD. (d-e) Bar plot showing the relative abundances of the top 10 differential genera and microbial function based on BugBase in patients with MAFLD before and after WMT. (f) Heatmap depicting correlations between genus-level abundance and proportions of circulating innate lymphoid cells in patients with MAFLD. MAFLD, metabolic-associated fatty liver disease; PCoA, principal coordinate analysis; WMT, washed microbiota transplantation. *p < 0.05; **p < 0.01; ***p < 0.001.
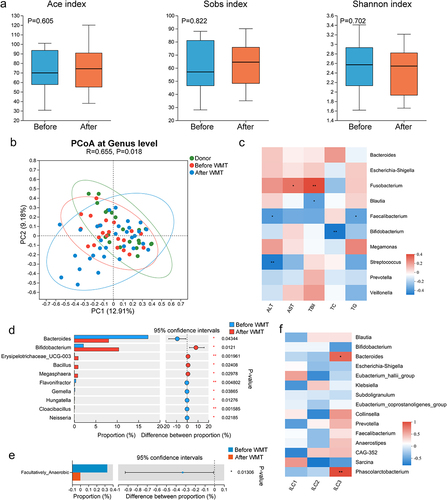
Figure 5. The proportion of ILC3s increased outside the liver and decreased within the liver in both human and murine MAFLD. (a) Representative flow cytometric gating strategy. (b) Comparison of the proportions of circulating total ILCs and ILCs subsets between healthy controls (HC, n = 66) and patients with MAFLD (n = 93). (c) Correlation between the proportion of circulating ILC3s and the levels of fat attenuation parameters, blood cholesterol, LDL-C, and ALT in patients with MAFLD. (d) Representative confocal microscopy images of liver sections from patients with or without MAFLD; arrows indicate ILC3s (CD3−RORγt+); scale bar: 20 μm. (e) Comparison of ILC3 levels in PBMCs, small intestine (SI), and liver between healthy (n = 6) and MAFLD mice (n = 9). (f) Correlation between the levels of circulating and hepatic ILC3s and hepatic triglyceride concentrations in mice. ILC3, group 3 innate lymphoid cells; ILCs, innate lymphoid cells; MAFLD, metabolic-associated fatty liver disease. *p < 0.05; **p < 0.01.
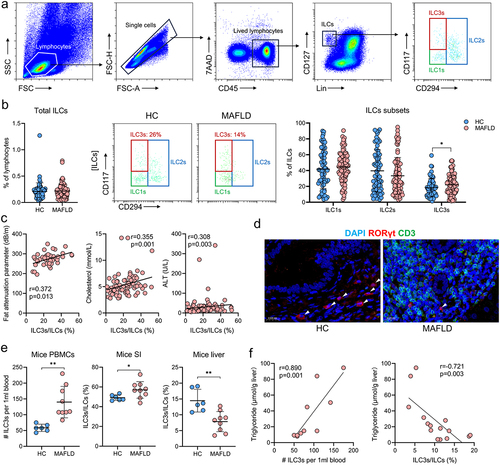
Figure 6. WMT significantly decreased the proportion of circulating ILC3s in MAFLD patients and mice, and increased the proportion of hepatic ILC3s in MAFLD mice. (A) The proportion of circulating ILC3s in patients with MAFLD before and after WMT (n = 5). (B) Proportion of ILC3s from PBMCs, liver, and small intestine (n = 3) in MAFLD mice treated with MAFLD (control) or healthy microbiota (WMT). n = 8 mice per group. ILC3, type 3 innate lymphoid cells; MAFLD, metabolic-associated fatty liver disease; WMT, washed microbiota transplantation. *p < 0.05; **p < 0.01.
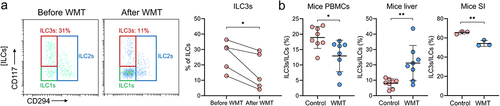
Figure 7. WMT might promote ILC3s homing to the liver through the upregulation of CXCR6 expression on ILC3s. (a) Proportion of Ki-67+ ILC3s in the liver of MAFLD mice after WMT. (b) Study design for intestine-derived ILC3s tracing experiments. (c) Representative flow plot depicting intestine-derived CD45.2+ ILC3s in the livers of CD45.1+ MAFLD mice (n = 3/group). (d) The number of CD45.2+ ILC3s migrating to the spleen, liver, PBMC, small intestine (SI), mesenteric lymph node (MLN), and large intestine (LI) of CD45.1+ MAFLD mice. (e) Representative flow plots depicting the expression of different liver-homing chemokine receptors in hepatic ILC3s of healthy mice. (f) Heatmap of RNA sequencing data showing differentially expressed chemokine genes in healthy and MAFLD mice. (g) Comparison of the mean fluorescence intensity (MFI) of CXCR6 on ILC3s and the proportion of CXCR6+ ILC3s in the liver between healthy and MAFLD mice (n = 3/group). (h) Study design of CXCR6 blocking experiments. (i) The proportion of ILC3s in the livers of MAFLD mice after receiving ILC3s treated with CXCR6 antibody (n = 9) or isotype control (n = 7). (j) The proportion of CXCR6+ ILC3s in the livers of mice treated with MAFLD (control, n = 8) or healthy microbiota (WMT, n = 8). MAFLD, metabolic-associated fatty liver disease. *p < 0.05; **p < 0.01.
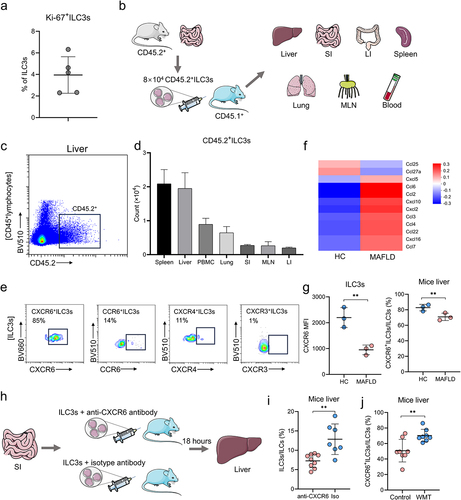
Figure 8. Hepatic ILC3s mitigated hepatic steatosis and liver damage via IL-22 secretion. (a) Study design involving MAFLD mice treated with PBS (n = 4) or ILC3s (n = 9). (b) Concentrations of triglycerides and cholesterol in the liver of MAFLD mice. (c) Representative H&E staining of the liver sections; scale bar: 50 μm. (d-e) MAFLD activity score (NAS) and levels of blood alanine transaminase (ALT), aspartate transaminase (AST), triglyceride, and cholesterol in MAFLD mice treated with ILC3s or PBS. (f) IL-22 concentration in the livers of MAFLD mice treated with ILC3s or PBS. (g) Correlation between the concentration of hepatic IL-22 and triglyceride levels in mice. ILC3, group 3 innate lymphoid cells; MAFLD, metabolic-associated fatty liver disease; MCD, methionine- and choline-deficient diet. *p < 0.05; **p < 0.01; ***p < 0.001.
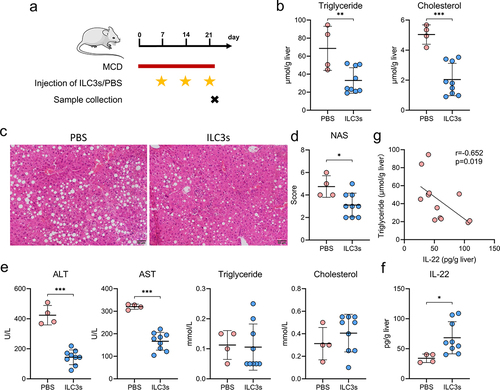
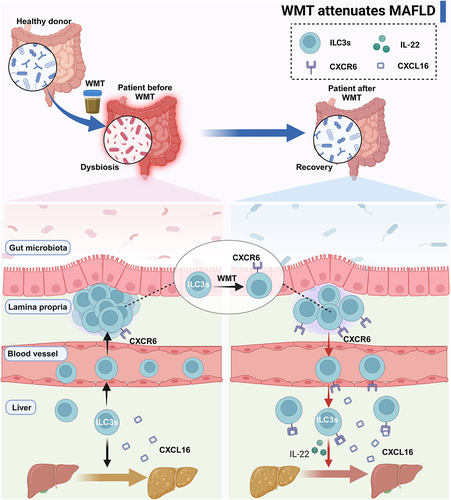
Figure 9. Graphical abstract. MAFLD patients and mice presented an altered composition of gut microbiota and an abnormal distribution of ILC3s due to the reduced expression of CXCR6 on ILC3s. WMT treatment resulted in the reconfiguration of the gut microbiota composition and upregulation of CXCR6 expression on ILC3s, consequently leading to liver-homing of ILC3s from ex-hepatic sites. Hepatic ILC3s attenuated hepatic steatosis in MAFLD patients and mouse models by secreting IL-22. ILC3s, group 3 innate lymphoid cells; MAFLD, metabolic-associated fatty liver disease; WMT, washed microbiota transplantation.
240325 Supplementary material clean.docx
Download MS Word (627.8 KB)Data availability statement
The data that support the findings of this study are available in https://www.ncbi.nlm.nih.gov/bioproject/PRJNA1035094., reference number PRJNA1035094, https://www.ncbi.nlm.nih.gov/bioproject/PRJNA1035440, reference number PRJNA1035440, and within the article and its supplementary materials.