
Figures & data
Figure 1. GBS is present in the stool of prematurely born infants. (a) Flow chart of study design, analysis, and specimen collection. (b) Relative abundance of GBS in stool by number of days post birth. (c) Relative abundance of GBS in stool over time of sampling in NICU cohort. N = 73 participants in B, n = 67 participants with at least 2 samples per individual C.
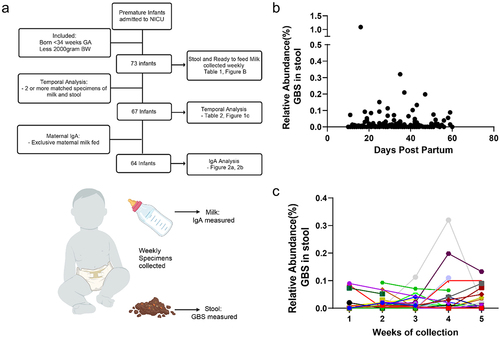
Table 1. Participant demographics and GBS colonization.
Figure 2. GBS colonization is associated with low dietary IgA. (a) Relative abundance of GBS in stool by amount of total IgA in diet. Pearson’s correlation *p = 0.0446 in A, linear regression (green dotted line). (b) Concentration of total IgA in milk categorized by GBS colonization patterns. “GBS undetected” = GBS undetected in all specimens, “initial GBS” = first specimen contained GBS while GBS was undetected in later specimens; “consistent GBS” = first and later specimens contained GBS, and “GBS in last weeks” = GBS was undetected in first specimens while later specimens contained GBS. Kruskal–Wallis test *p = 0.047, with no significant difference in multiple comparisons in B. N = 64 participants, exclusively fed maternal milk with at least 2 samples per individual in a and B. (c) GBS-cross-reactive IgA in breast milk against various GBS strains, shown in absorptive units at 450 nm. n= at least 20 per group in C.
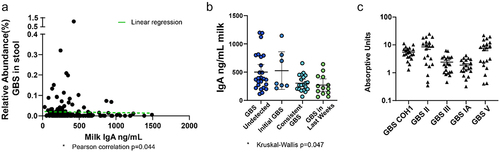
Figure 3. GBS is transmitted vertically during pregnancy and causes sepsis and mortality in pups. C57Bl/6 dams were vaginal colonized with107 colony-forming units (CFUs) GBS COH1 on E18. (a) CFUs per gram tissue in dams on E20 following vaginal administration of GBS on E18, n = 3 dams. (b) CFUs per gram fetal tissue on E20, n = 6, 2 fetus from 3 independent dams from A. (c) Survival of pups after EOS. n = 3 independent litters per group with at least 5 pups at birth. *p = 0.0006 on Kaplan-Meier survival curve. (d) Weight change over time in uninfected or infected with GBS. Surviving pups were split from pups succumbing to GBS infection in C, weight gain normalized to day of life 1. Two-way ANOVA with Tukey’s multiple comparison test. n = 3 independent litters per group with at least 5 pups at birth from C.
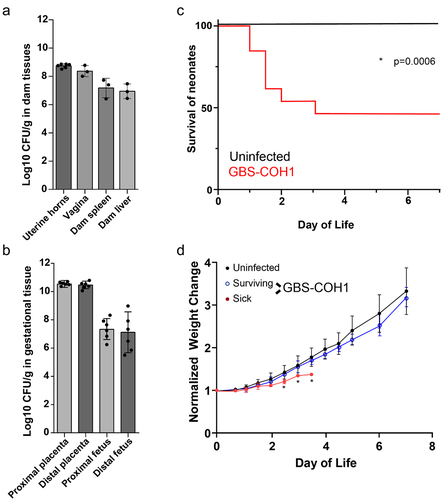
Figure 4. GBS EOS is associated with pneumonia. C57Bl/6 dams were vaginal colonized with 107 CFUs GBS COH1 on E18. (a) CFUs per gram of organ in healthy and sick pups on P3, healthy and sick was defined by weight gain. MLN = mesenteric lymph node, SI = small intestine. (b) ELISA of tissue homogenates for IL-6 and (c) IL-1B. A–C, n = 6 per group, 2 sick and 2 healthy from 3 independent litters. (d) Neutrophils in the lung after EOS on P3, defined as CD45+ Ly6G+, and (e) percent of MHCII+ antigen experienced neutrophils. D-E, n = 8 per group, across 3 independent litters. Two-way ANOVA with Tukey’s multiple comparison test in (a-c) comparing cytokines in each organ to control (uninfected) and Mann-Whitney (d, e) with *p < 0.05.
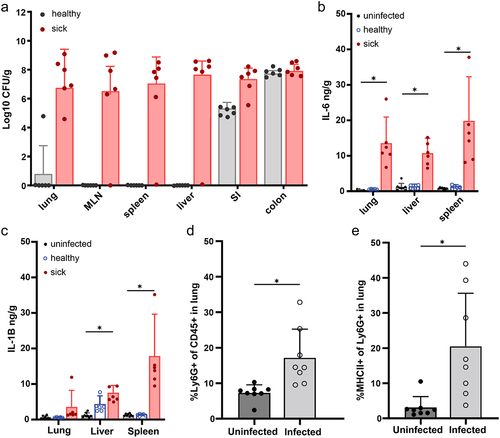
Figure 5. GBS colonizes the neonatal intestine and displays limited translocation. (a) CFUs in intestines and mesenteric lymph node (MLN) of 6 day old mice following: “mat Tran”= maternal transmission of GBS as in figure 4 or “oral P5” = 24 hours after gavage with 106 CFU GBS. N = 7 per group, across 3 independent litters. (b) CFUs in the mesenteric lymph node of 6 day old mice after gavage with bacterial isolates and treatment with EGFR inhibitor (EGFRi). N = 6 per group. One-way ANOVA with Tukey’s multiple comparison test, *p < 0.05. (c) Relative binding of mucin to bacterial strains by contact time. two-way ANOVA (c) with Tukey’s multiple comparison test, *p < 0.05. (d) Survival of mice after oral gavage of GBS, with EGFRi, and with pretreatment of oral ampicillin. N = 6 per group across 3 independent litters. Kaplan-Meier curve with *p < 0.05. (e) CFUs in intestines, mesenteric lymph node, spleen, and liver 48 hours after oral gavage of GBS, with EGFRi, and with pretreatment of oral ampicillin. Red symbols indicated GBS+ translocation as identified by selective agar. N = 4 per group. (f) Survival of mice after intraperitoneal injection of GBS or vehicle. n = 5 per group. Kaplan-Meier curve with *p < 0.05.
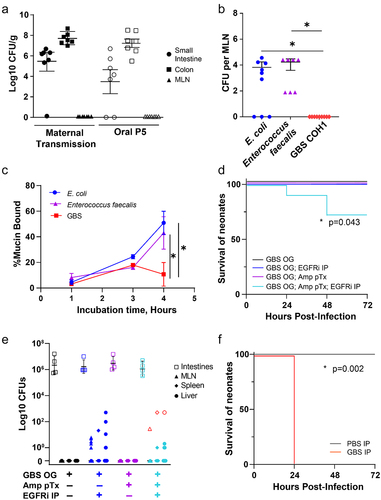
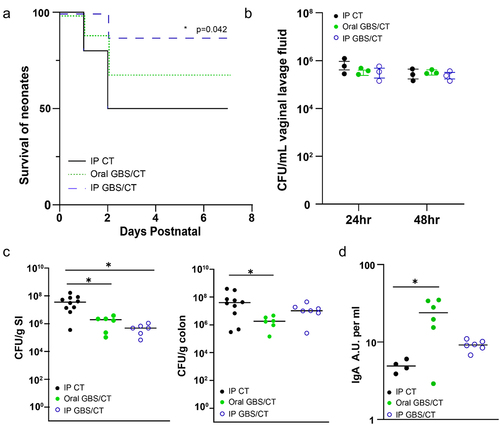
Figure 6. Maternal vaccination decreases GBS colonization in pups and improves EOS survival. Dams were immunized with ethanol-killed GBS and cholera toxin (CT) or CT alone, and then bred and colonized with GBS on E18. (a) Survival of pups during EOS after maternal vaccination prior to pregnancy. Vaccination with ethanol-killed GBS COH1 and cholera toxin delivered orally or intraperitoneally, or cholera toxin alone IP. N = 3 dams per group, with subsequent litters. Kaplan-Meier survival curves with * p < 0.05. (b) Colonization by GBS COH1 in the vaginal tract of pregnant mice after inoculation at ED18 in mice orally treated with cholera toxin or ethanol-killed GBS with cholera toxin. N = 3 dams per group. (c) CFUs in small intestinal (SI) and colonic contents of pups at PN7 after maternal vaccination prior to pregnancy. (d) Relative amount of GBS-binding IgA in the stomach contents of pups after maternal vaccination, measured in absorptive units. One-way ANOVA (C,D) and with *p < 0.05 comparing to control (IP CT).
Supplemental Material
Download Zip (134.1 KB)Data availability statement
All data supporting the findings of this study are available within the article.