
Figures & data
Table 1. Clinical characteristics of participants.
Table 2. Primer sequences.
Table 3. Antibodies used for FACS.
Figure 1. Increased inflammatory response by phages derived from individuals with T2D.
(a) Workflow. Fresh fecal samples were collected from individuals with type 2 diabetes (T2D) and healthy controls (n = 12 per group). Fecal samples were homogenized and phages were separated by (ultra)centrifugation as well as tangential filtration (0.2 µm) from bacteria and their metabolites. Free fecal phages were quantified with florescence microscopy. Healthy donor human immune cells were incubated with purified phages.
(b) Viral titer determined by fluorescent microscopy in VLPs per ml fecal filtrate (normalized for fecal input).
(c) LPS concentration before and after CsCl purification.
(d-j) Purified fecal phages were incubated with human dendritic cells for 24 h, followed by 72 h with human T cells. Cytokines were measured in cell culture supernatant and RNA expression was measured in the cells.
(d-e) IL-6 gene expression in and protein secretion from healthy donor dendritic cells.
(f-h) Cell surface markers CD86, CD80, and HLA-DR on healthy donor dendritic cells.
(i-j) IFN-y gene expression in and protein secretion from T cells.
Abbreviations: VLP, virus-like particle; LPS, lipopolysaccharide; T2D, type 2 diabetes; CsCl, cesium chloride; FFT, fecal filtrate. *p < .05, **p < .01, ***p < .001.
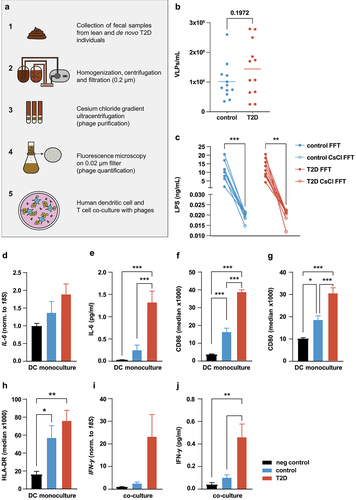
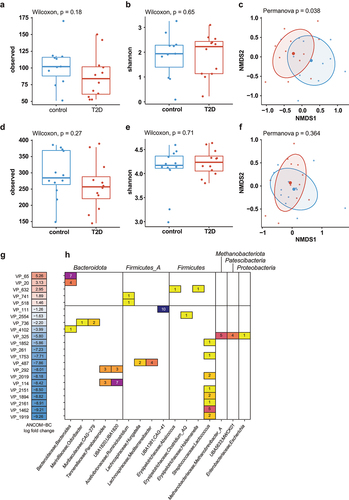
Figure 2. Differential viral populations in healthy vs T2D individuals.
(a) Richness and (b) alpha-diversity (Shannon index) of viral clusters in healthy and T2D in the VLP fraction
(c) Non-metric multidimensional scaling (NMDS) on beta diversity (Bray-Curtis) of viral clusters in healthy and T2D in the VLP fraction
(d) Richness and (e) alpha-diversity (Shannon index) of viral clusters in healthy and T2D in the bulk fraction
(f) NMDS on beta diversity (Bray-Curtis) of viral clusters in healthy and T2D in the bulk fraction
(g) Differentially abundant (ANCOM-BC) viral populations in healthy and T2D.
(h) Host predictions for differentially abundant viral populations (g) in healthy and T2D. Colors and numbers indicate the number of viral contigs with a given host prediction within that VP.
Supplemental material