Figures & data
Figure 1. Rapamycin decreases the rate of fibroblast proliferation. 2DD fibroblasts were grown under normal culture conditions or in the presence of 500 nM rapamycin. Cell numbers were monitored and the population doubling times (Y axis) calculated over 0h, 72h, 120h, 168h, and 216h (X axis) (red bars represent proliferative fibroblasts and black bars represent rapamycin-treated fibroblasts for both panels). The total number of population doublings (Y axis) were plotted for control (red) and rapamycin-treated cultures (black). Data represent single biological replicates and repeated 2 additional times (data not shown) demonstrating parallel trends. Ki67 was immuno-labeled in cells cultured in rapamycin for 0h, 72h, 120h, 168h and 216h (C). Ki67 positive (Ki67+) and Ki67 negative (Ki67-) cells are shown on the left side of the panel. Ki67 was false colored green. Chromatin was counterstained with H33342 (blue). The percentage of Ki67 positive (%Ki67+, Y axis) cells calculated for each time point are shown (X axis). Error bars represent the SEM of the percent cells from individual counts. Scale bar = 10 μm.
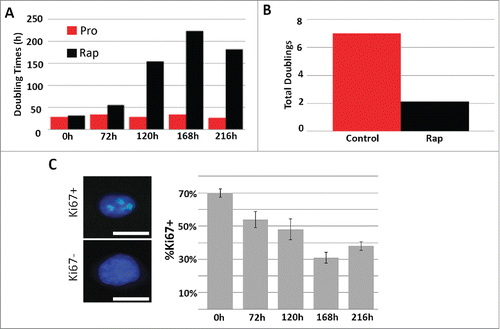
Figure 2. Chromosome re-localization following rapamycin treatment and quiescence induction. Chromosomes 18 (top row), 10 (middle row) and the X chromosome (bottom row) were identified in proliferating (Pro, first column), quiescent (Qui, second column) and rapamycin-treated (Rap, third column) 2DD fibroblasts by chromosome painting. Red signal represents the identified chromosomes; chromatin was counter stained with H33342 (blue). Scale bar = 5 μm for all images. Following painting, erosion analysis was performed to designate the location of the chromosomes within the nuclear volume. Nuclei were broken into 5 concentric shells of area, shell 1 being most exterior and shell 5 being most interior. Graphs for each specific chromosome represents the measured ratio of % chromosome signal divided by the % H33342 signal in each shell (Y axis) to normalize for DNA content in each shell (X axis). Proliferative positioning is represented by blue bars, quiescent by red and rapamycin-treated in gray. Error bars = SEM. Two tailed Student's test for unequal variance were used to demonstrate significant difference in chromosome positioning. ** indicates that both proliferative and quiescent measurements had p values ≤0 .01. * indicates that only rapamycin had significant changes in chromosome positioning. # indicates a significant difference (p values ≤0 .01) between quiescent and rapamycin-treated samples. Correlation calculations were also performed to demonstrate if the trend in chromosome positioning was similar or divergent between the samples. Chromosome 18 Pro vs. Qui R2 = −0.83, Pro vs. Rap R2 = −0.99 and Qui vs. Rap R2 = 0.87. Chromosome 10 Pro vs. Qui R2 = 0.43, Pro vs. Rap R2 = 0.64 and Qui vs. Rap R2 = 0.95. X chromosome: Pro vs. Qui R2 = 0.84, Pro vs. Rap R2 = 0.98 and Qui vs. Rap R2 = 0.91.
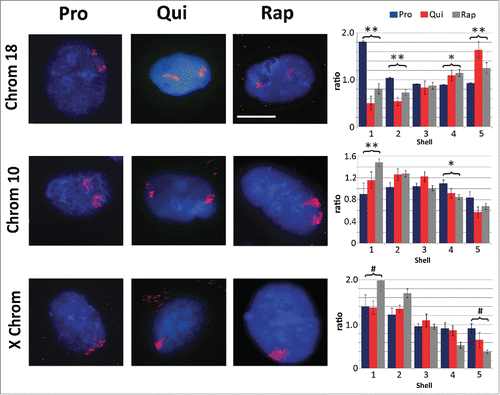
Figure 3. Scatter plots demonstrate different transcript profiles following quiescence induction or rapamycin treatment. Scatter plot comparing transcript abundance in quiescent and proliferating fibroblasts. The number of counts for each transcript identified by RNA-seq for proliferative (X axis) and quiescent (Y axis) fibroblasts was log-base-2 transformed with each square representing a single transcript. Transcripts exhibiting ≥5-fold increase and decrease in quiescent fibroblasts when compared to proliferative samples are marked in red (A). Gray squares represent transcripts that did not change abundance ≥5-fold. The number of counts for each transcript identified by RNA-seq for proliferative (X axis) and rapamycin-treated (Y axis) fibroblasts was log-base-2 transformed with each square representing a single transcript. Gray squares represent transcripts that did not change abundance ≥5-fold. Transcripts exhibiting ≥5-fold increase and decrease in rapamycin treated fibroblasts when compared to proliferative samples are marked in blue (B). Blue squares in panel A represent those transcripts that had a ≥5-fold increase and decrease in rapamycin treated fibroblasts and the red squares in panel B represent those transcripts that had a ≥5-fold increase and decrease in quiescent fibroblasts. Green squares in both panels represent transcripts that had a ≥5-fold increase or decrease under both quiescence induction and rapamycin treatment when compared to proliferative fibroblasts. Red or blue text highlights specific genes within each scatterplot. Venn diagrams demonstrating the number of genes up-regulated (left) or down regulated (right) from quiescent (red circles) or rapamycin-treated (green circles) fibroblasts in comparison to proliferating fibroblasts (C). Numbers in the overlapped areas indicate the number of genes changing expression in both quiescent and rapamycin treated fibroblasts.
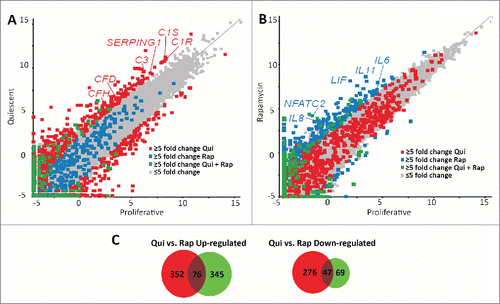
Table 1. Network pathway annotation terms enriched in quiescence upregulated genes. Genes ≥5 fold up-regulated in response to quiescence induction were analyzed for enrichment of KEGG terms. The identified enriched pathway KEGG annotation terms (GeneSet) from network analyses are listed. The total number of genes from the network identified to be upregulated in response to quiescence and belonging to a specific pathway was identified. p-value (with 0 values equating to<0.0001) and false discovery rates (FDR) are presented. Nodes identify specific genes/proteins from our data sets present in the networks.
Table 2. Network pathway annotation terms enriched in genes downregulated in quiescent fibroblasts. Genes ≥5 fold down-regulated in response to quiescence induction were analyzed for enrichment of KEGG terms. The identified enriched pathway annotation terms (GeneSet) from network analyses are listed. The total number of genes from the network identified to be downregulated in response to quiescence and belonging to a specific pathway were identified. p-value (with 0 values equating to<0.0001) and false discovery rates (FDR) are presented. Nodes identify the genes/proteins from our datasets present in the networks. For brevity only the top 20 most significant annotations are presented.
Figure 4. Protein levels of IL-6, IL-8 and LIF increased as a function of rapamycin treatment. ELISA assays were used to confirm that the rapamycin-induced increases in transcript profiles from the IL-6 and IL-8 genes also led to increased levels of secreted cytokines (A). Three biological replicates of culture media from proliferative (PRO) and 5 day rapamycin-treated cells (RAP) were subjected to sandwich ELISA and the concentration of both IL-6 and IL-8 determined. p-values for one tailed Student's t-tests are shown for IL-6 (* p=0.006) and IL-8 (** p=0.038). Error bars demonstrate the SEM. Equivalent amounts of whole-cell protein extracts from proliferative (PRO) and rapamycin-treated (RAP) fibroblasts were subjected to protein gel blotting for the LIF protein (˜20KDa) (B). A blot for β-actin was also used as a load control. Molecular weights (in KDa) are shown to the right of the blots.
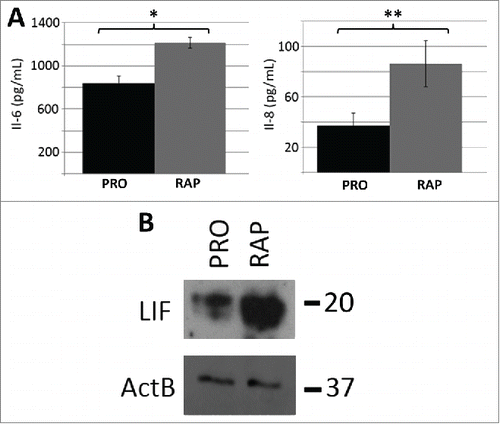
Table 3. Network pathway annotation terms enriched in rapamycin up-regulated genes. Genes ≥5 fold upregulated in response to rapamycin treatment were analyzed for enrichment of KEGG terms. The identified enriched pathway annotation terms (GeneSet) from network analyses are listed. The total number of genes from the network identified to be up-regulated in response to rapamycin and belonging to a specific pathway were identified. p-value (with 0 values equating to<0.0001) and false discovery rates (FDR) are presented. Nodes identify the genes/proteins from our data sets present in the networks. Only the top 20 most significant annotations are shown.
Table 4. Network pathway annotation terms enriched in genes down-regulated in rapamycin-treated fibroblasts. Genes ≥5 fold downregulated in response to rapamycin treatment were analyzed for enrichment of KEGG terms. The identified enriched pathway annotation terms (GeneSet) from network analyses are listed. The total number of genes from the network identified to be down-regulated in response to rapamycin and belonging to a specific pathway were identified. p-value (with 0 values equating to<0.0001) and false discovery rates (FDR) are presented. Nodes identify to the genes/proteins from our datasets present in the networks.
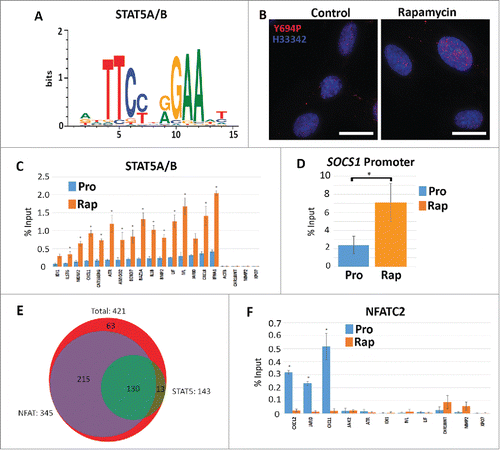
Figure 5. Increased STAT5A/(B)promoter occupancy but not NFACT2 in genes upregulated in response to rapamycin. Using CLOVER, the promoters of genes that increased expression following rapamycin treatment were enriched in STAT5A/B transcription factor binding sites. Position weight matrix/sequence logo of this binding site is shown (A). Scale to the left represents the log-base-2 of the information content of each nucleotide and the bottom scale represents the position of those nucleotides within the binding site. Immuno-fluorescence for phosphorylated Y694-STAT5A/B (Y694P; red) in proliferating (Control) and rapamycin-treated (Rapamycin) fibroblasts (B). Chromatin is counterstained with H33342 (blue). Scale bar = 10 μm. ChIP assays were used to compare promoter occupancy of STAT5A/B in proliferative (Pro/blue) and rapamycin treated (Rap/orange) samples (C). Promoters analyzed are given (X-axis) and the percent enrichment over input reported (Y-axis). For all ChIP assays, error bars represent the SEM and * indicate significant enrichment with p-values from one tailed t-tests ≤0 .05. ChIP assays for STAT5A/B promoter occupancy in the promoter of the SOCS1 gene under proliferative (Pro) and rapamycin treatment (Rap) (D). Venn diagram indicating the number of genes up-regulated by rapamycin (red; 421 genes) that shared STAT5A/B (green; 143 genes) and NFAT (purple; 345 genes) binding sites (E). ChIP assays were also performed for NFATC2 promoter occupancy. Proliferative (Pro/blue) and rapamycin treated (Rap/orange) samples were compared. Promoters analyzed are given at the bottom and the percent enrichment over input reported (F).
