1,141
Views
7
CrossRef citations to date
0
Altmetric
EXTRA VIEW

Insights into the gate of the nuclear pore complex

, &
Pages 1-7 | Received 04 Nov 2015, Accepted 07 Dec 2015, Published online: 02 Mar 2016

Figures & data

Figure 1. The central channel of the NPC. A rendered view of a central x–y-section (10-nm thick) of the native NPC shows the organization of the central channel; the SR is depicted in blue, the filamentous protrusions of the central channel ring in orange, the nuclear envelope in gray and the luminal densities in yellow. A dotted ring in the center highlights the very central 17 nm that were masked in in this structural map. The figure was modified from.Citation20
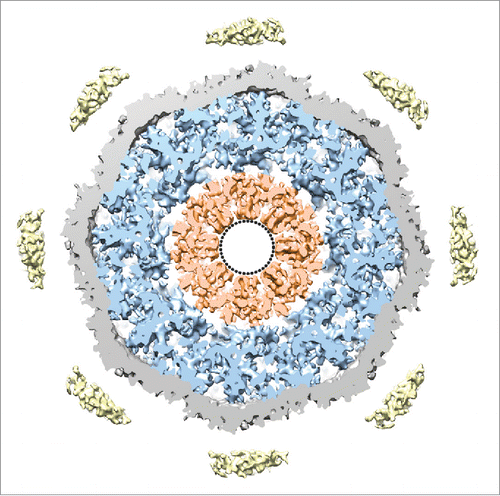
Figure 1. The central channel of the NPC. A rendered view of a central x–y-section (10-nm thick) of the native NPC shows the organization of the central channel; the SR is depicted in blue, the filamentous protrusions of the central channel ring in orange, the nuclear envelope in gray and the luminal densities in yellow. A dotted ring in the center highlights the very central 17 nm that were masked in in this structural map. The figure was modified from.Citation20

Figure 2. Structural differences of the NPC at different transport states. (A) Schematic representation of cargo being transported through the NPC in the wildtype state (wild type-NPC, left) and after actinomycin D treatment (ActD-NPC, right). Ribosomal subunits are depicted in green colors, RNA in blue colors, and proteins in red colors. (B and C) A view of the 25-nm thick central nucleocytoplasmic section of the wild type-NPC (left) and the ActD-NPC (right) demonstrates the structural differences of the 2 states of the NPC. (B) The local resolution of the structures is depicted by surface coloring. (C) The local cross-resolution values of the structures are visualized by surface coloring and reveal regions where structural changes occur due to altered transport activity (red color). (B and C) Resolution values are given by the color key. The figure was modified from.Citation20
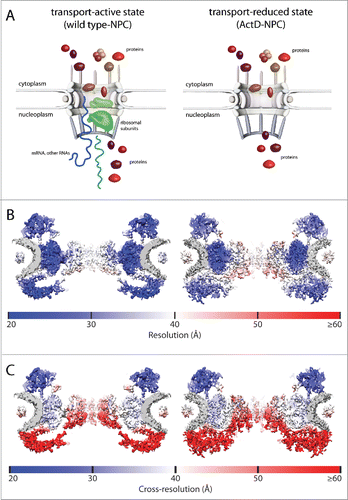
Figure 2. Structural differences of the NPC at different transport states. (A) Schematic representation of cargo being transported through the NPC in the wildtype state (wild type-NPC, left) and after actinomycin D treatment (ActD-NPC, right). Ribosomal subunits are depicted in green colors, RNA in blue colors, and proteins in red colors. (B and C) A view of the 25-nm thick central nucleocytoplasmic section of the wild type-NPC (left) and the ActD-NPC (right) demonstrates the structural differences of the 2 states of the NPC. (B) The local resolution of the structures is depicted by surface coloring. (C) The local cross-resolution values of the structures are visualized by surface coloring and reveal regions where structural changes occur due to altered transport activity (red color). (B and C) Resolution values are given by the color key. The figure was modified from.Citation20

Figure 3. Possible transport routes across the NPC. (A) A view of the 25-nm thick central nucleocytoplasmic section of the NPC with the cytoplasmic side facing upward. The axes show the dimensions of the NPC in the x- and z-direction. (B) A surface-rendered view of the NPC with the nuclear side facing upward displays a view on the nucleoplasmic ring of the NPC and its extended porous meshwork (green). (A and B) The nuclear envelope is depicted in gray, the luminal densities in yellow, the SR in blue, the CPR is shown in gold, and the NPR in green color. The central transport route through the NPC is indicated by orange tubes. An alternative route is traced by purple tubes. (B) Notably, the peripheral channels (purple tubes) extend all the way through this meshwork. The figure was modified from.Citation20
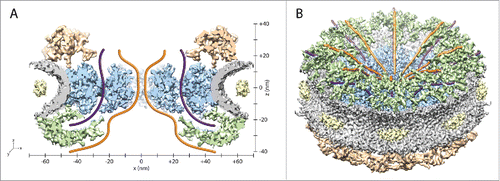
Figure 3. Possible transport routes across the NPC. (A) A view of the 25-nm thick central nucleocytoplasmic section of the NPC with the cytoplasmic side facing upward. The axes show the dimensions of the NPC in the x- and z-direction. (B) A surface-rendered view of the NPC with the nuclear side facing upward displays a view on the nucleoplasmic ring of the NPC and its extended porous meshwork (green). (A and B) The nuclear envelope is depicted in gray, the luminal densities in yellow, the SR in blue, the CPR is shown in gold, and the NPR in green color. The central transport route through the NPC is indicated by orange tubes. An alternative route is traced by purple tubes. (B) Notably, the peripheral channels (purple tubes) extend all the way through this meshwork. The figure was modified from.Citation20

Reprints and Corporate Permissions

Please note: Selecting permissions does not provide access to the full text of the article, please see our help page How do I view content?

To request a reprint or corporate permissions for this article, please click on the relevant link below:

Academic Permissions

Please note: Selecting permissions does not provide access to the full text of the article, please see our help page How do I view content?

Obtain permissions instantly via Rightslink by clicking on the button below:

If you are unable to obtain permissions via Rightslink, please complete and submit this Permissions form. For more information, please visit our Permissions help page.